ZigZag Arrow Indicator
ZigZag Arrow indicator is a perfect trend reversal detector. It is a need-have indicator for price action traders.
If your forex trading strategy is based on price action and market flow concepts, identifying key swing levels is a skill that you must possess. Swing lows and swing highs are essential points that help determine the price direction and reversal point, and this is where the zigzag arrow indicator comes to help.
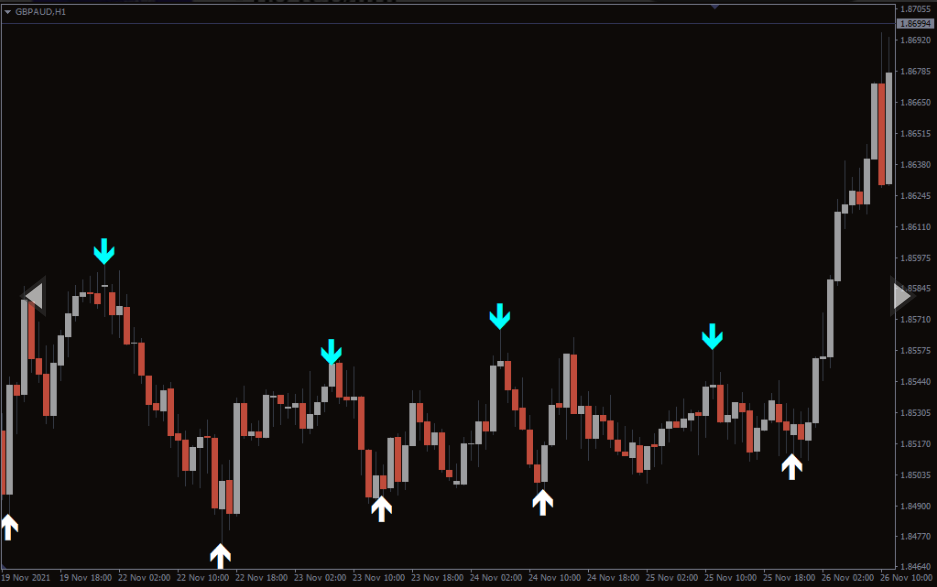
The zigzag arrow is quite similar to the conventional zigzag indicator. It helps traders to objectively identify swing highs and swing lows. But unlike the ordinary zigzag indicator which connects the swing highs and swing lows to form a zigzag-like, downtrend structure, the Zigzag arrow posts arrows as the name suggests. The blue arrow up shows swing lows while the red arrow down shows swing highs.
It is, therefore, quite straightforward to use, even for beginner traders. In addition, you can use the indicator on any time frame to trade any currency pair.
Using the ZigZag Arrow Indicator to Identify Uptrend and Downtrends
Now let’s get to the juicy part. How do you use the indicator to trade profitably? Price action strategy defines an uptrend as a market with rising highs and swing lows. The swing highs are higher than previous swing highs, and swing lows are higher than preceding swing lows.
On the other hand, downtrend forms when the swing highs are lower than preceding swing highs and swing lows are lower than the previous swing lows.
After identifying these points you can incorporate other strategies and tools to determine the ideal market entry point. For instance, you can wait for the price to form a bearish price or chart pattern at the swing high. Similarly, it is prudent to wait for a bullish signal at the swing low to establish confluence and enter the market at an ideal point.
Buy Signal: Wait for the indicator to post a blue arrow and enter at the close of the candlesticks. Place the stop loss above the candlestick.
Sell Signal: Wait for the indicator to post a red arrow and enter at the close of the candlestick. Place stop loss below the candlestick open.
Chart Example
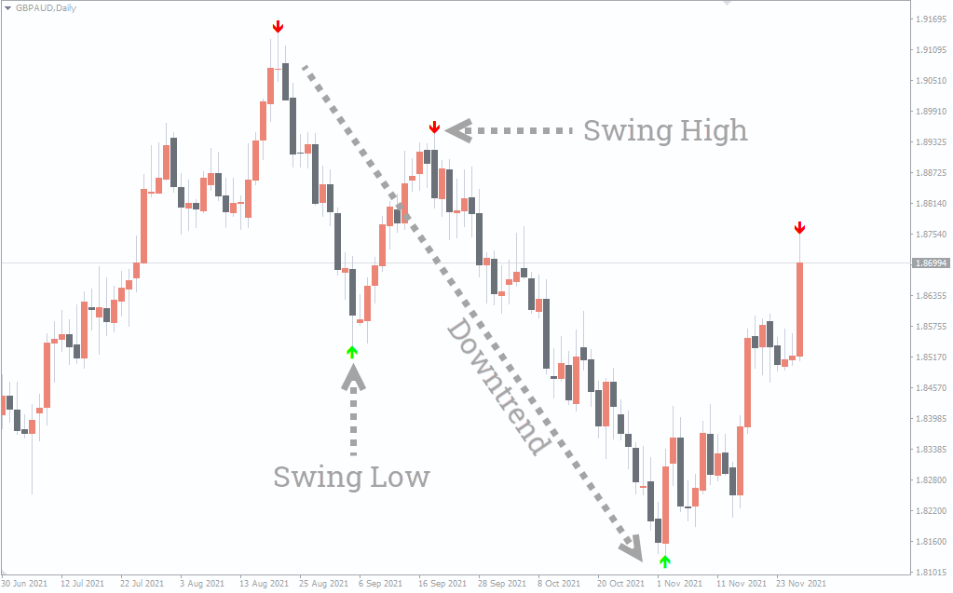
The chart above shows price movement for the Great Britain Pound against the Australian dollar. The swing high shown by the red arrow forms lower than the previous swing high, indicating a downtrend. The swing low pointed by the green arrow is followed by a lower swing low. This is a telltale sign of a downtrend. You can place the stop loss several pips above the swing high or below the swing low.
Conclusion
The Zigzag arrow indicator helps identify swing highs and swing lows objectively. You can then incorporate other technical tools and strategies to determine the right time to jump into the trade. The whole idea is to avoid closing trades due to minor pullbacks. This is one indicator you will definitely need.
You must be logged in to post a review.

Copyright 2025


Reviews
There are no reviews yet.