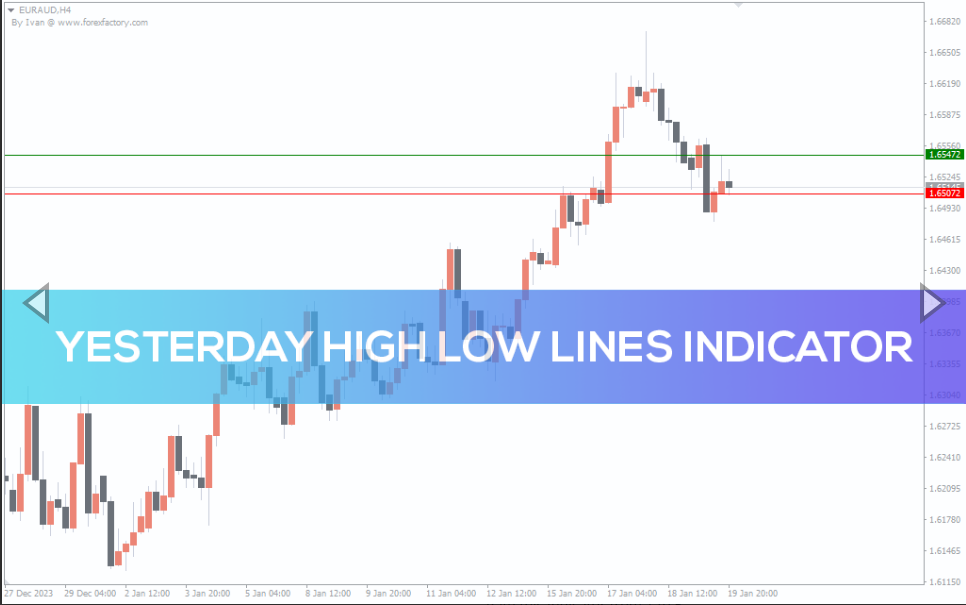
Yesterday High Low Lines Indicator For MT4 automatically draws the support and resistance at the high and low price of the previous day. Best for trend bias.
The Yesterday High Low Lines indicator for MT4 automatically plots horizontal lines on the price chart at the highest and lowest prices of previous trading day. In addition, these lines act as strong support and resistance. Hence, forex traders can use this indicator to identify the support and resistance and buy and sell upon a breakout or breakout failure.
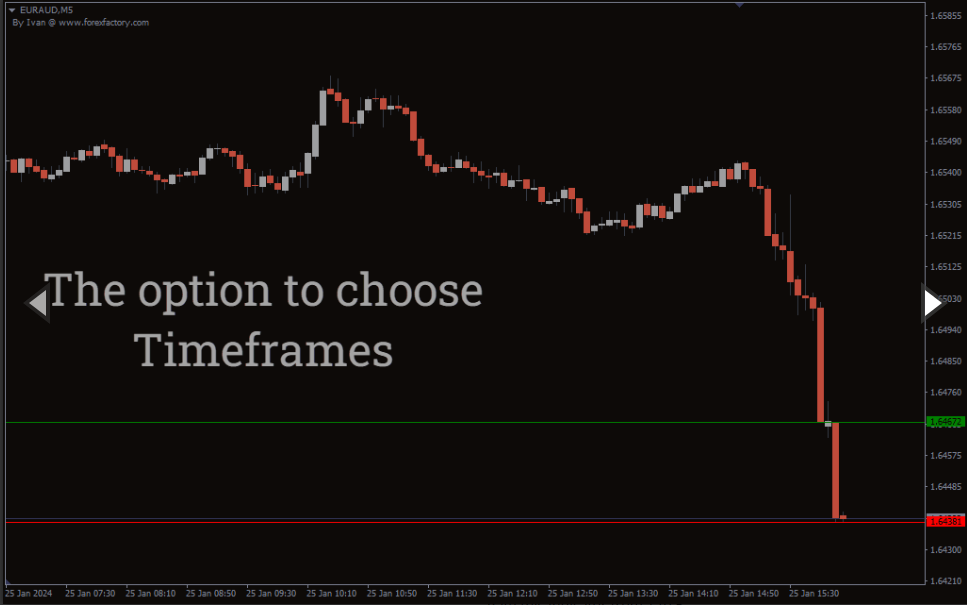
The indicator is easy to use and is suitable for both new and advanced forex traders. However, this indicator should be plotted on the daily price chart for precise identification of the support and resistance lines. It may not work on any other price chart precisely. So traders should place the indicator on a daily chart and manually mark these lines. Once marked manually, traders can use it on any chart time frame.
Yesterday High Low Lines Indicator For MT4 Trading Signals
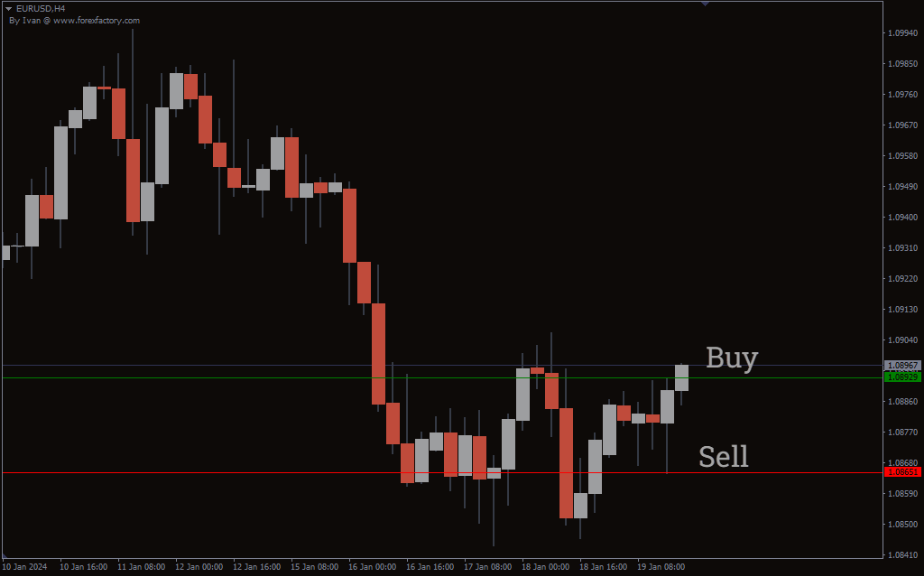
The indicator plots the high price or the resistance line as green. The low price or the support is red. A trading strategy is to enter the markets upon the breakout or breakout failure of these support and resistance lines.
Trend traders use the breakout direction of the previous day low or high price to identify the market direction of the current trading day. If the price breaks the resistance it forms a bullish bias for the rest of the day. Similarly, the break of the support forms a bearish market bias.
So, traders should wait for a clear breakout of these support and resistance lines before deciding the trend direction.
Conclusion
In summary, the Yesterday High Low Lines indicator for MT4 automatically identifies and plots support and resistance on the highest and lowest price of previous day.
Reviews
There are no reviews yet.
Be the first to review “Yesterday High Low Lines Indicator” Cancel reply
We use cookies to ensure that we give you the best experience on our website. If you continue to use this site we will assume that you are happy with it.Accept

Reviews
There are no reviews yet.