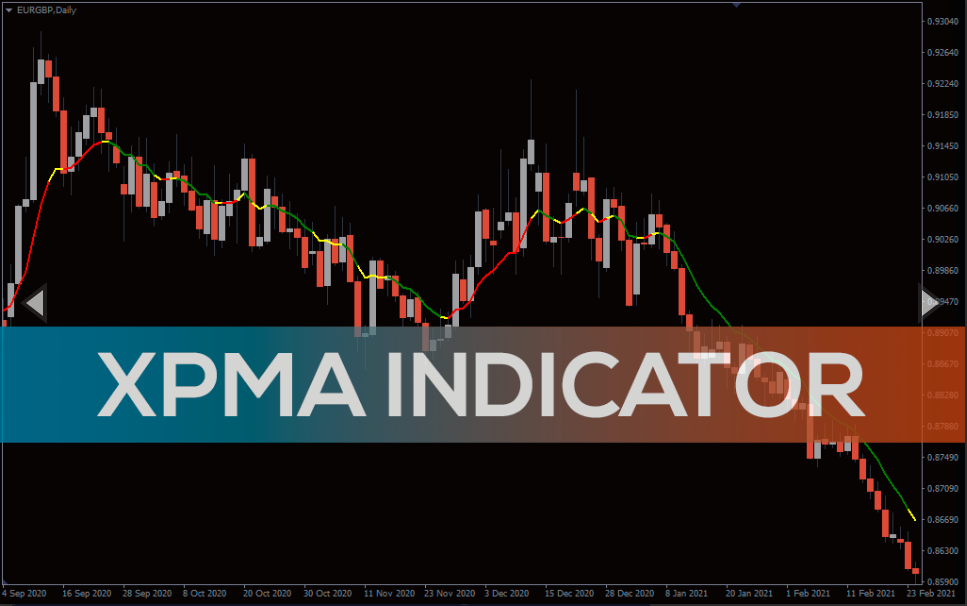
XPMA Indicator
XP moving average is an ideal tool for trading with the trend. An ideal trend reversal detector.
You are probably hearing this for the umpteenth time: the trend is your friend. It follows that you need an indicator that can help you trade with the trend. XPMA is one of the best trend following indicators in the market.
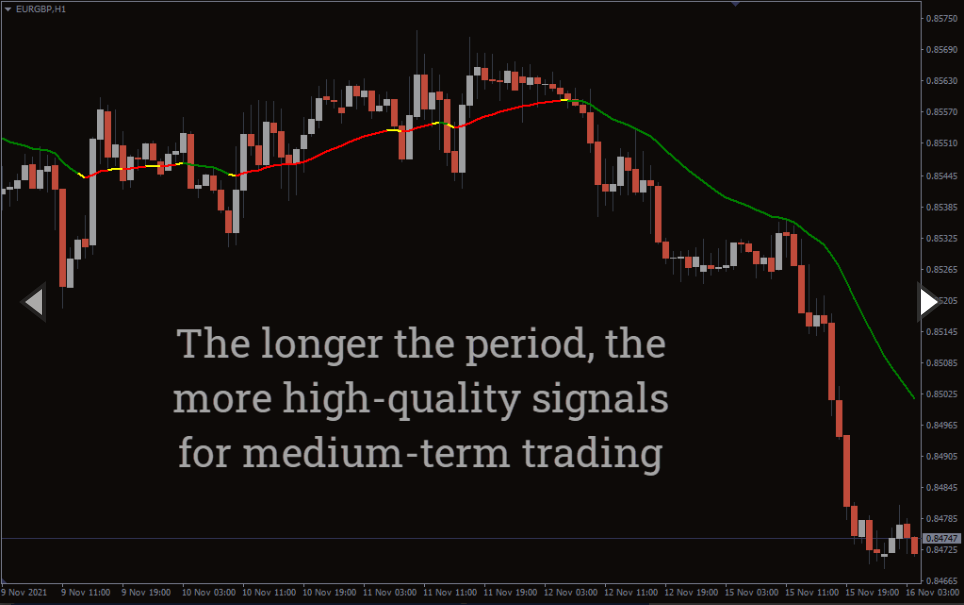
XP moving average indicator smoothens out the price by eliminating false positives during price fluctuations. It helps you determine the market trend and establish an ideal position to jump into the trade and reap maximum profits. The indicator is pretty much easy to use hence suitable for beginner traders.
XP MA indicator works perfectly for all currency pairs and trade instruments, and you can use it in all timeframes in the MT4 platform. You can incorporate the XP Moving Average indicator in your trading strategy and use it with other tools to boost positive outcomes. With that in mind, let’s now understand how you can use the indicator profitably.
XPMA Buy and Sell Signals
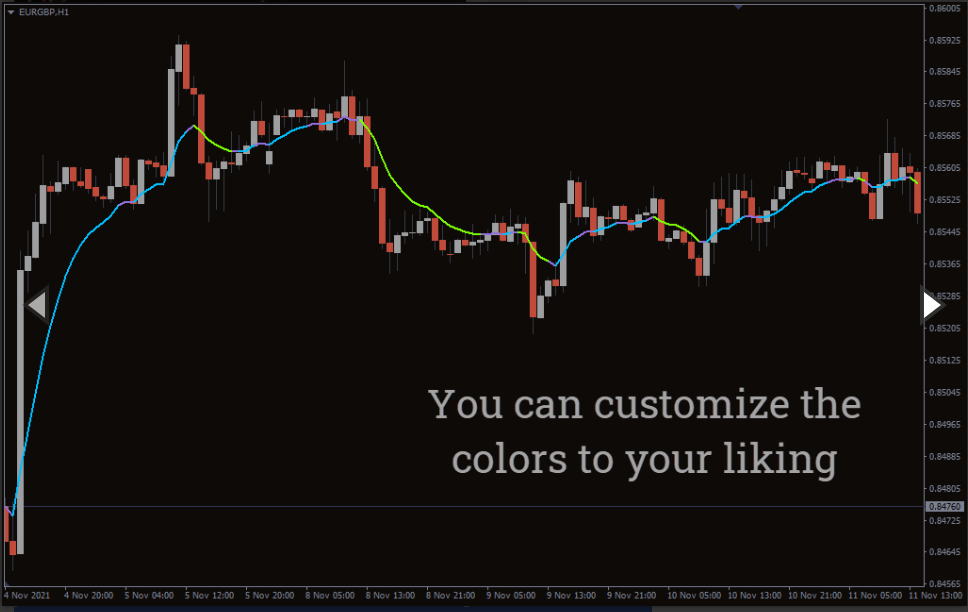
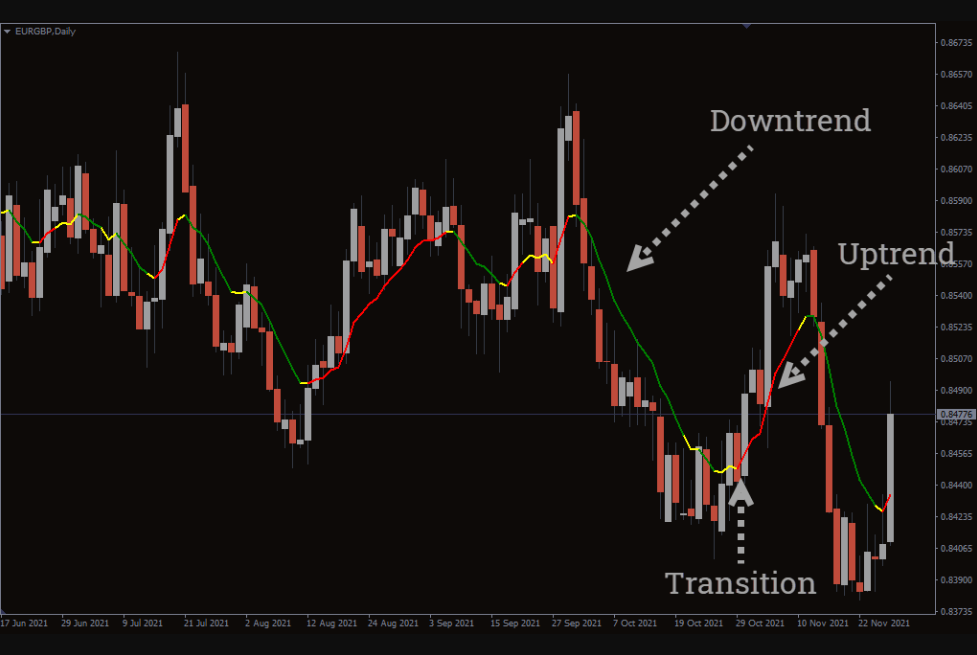
The XPMA indicator forms a moving average line that follows the price pattern. The line changes color to green, yellow, or red depending on the existing trend.
Buy Signal
Enter a long position when the indicator forms a bullish trend signal. In this case, the price should be above the price, and the indicator line should turn from green to red. Open a long position when the candlestick closes above the indicator. You can enter immediately the indicator turns red or wait for a price action confirmation.
Note that the indicator forms a yellowish color that signals a transition. The yellow color signals getting ready, as you do in traffic when the lights turn amber.
Sell Signal
The price should be below the indicator, and the indicator should turn green. It is imperative that you wait for the candlestick to close below the indicator.
For exit strategy, place the stop loss below the current indicator level. You can also place the stop loss below the recent swing low or high.
Chart Example
The chart above shows price movement for the euro against the Great Britain pound. During a downtrend, the price moves below the indicator, which is green in color? Similarly, the indicator changes color to red during an uptrend, and the price moves above the indicator line. It is pretty much easy to use the indicator.
Conclusion
The XPMA indicator is an enhanced version of the moving average. It shows the trend direction enabling you to take advantage of the trend. It is easy to use and quite effective. Give it a try today.
You must be logged in to post a review.

Copyright 2025

Reviews
There are no reviews yet.