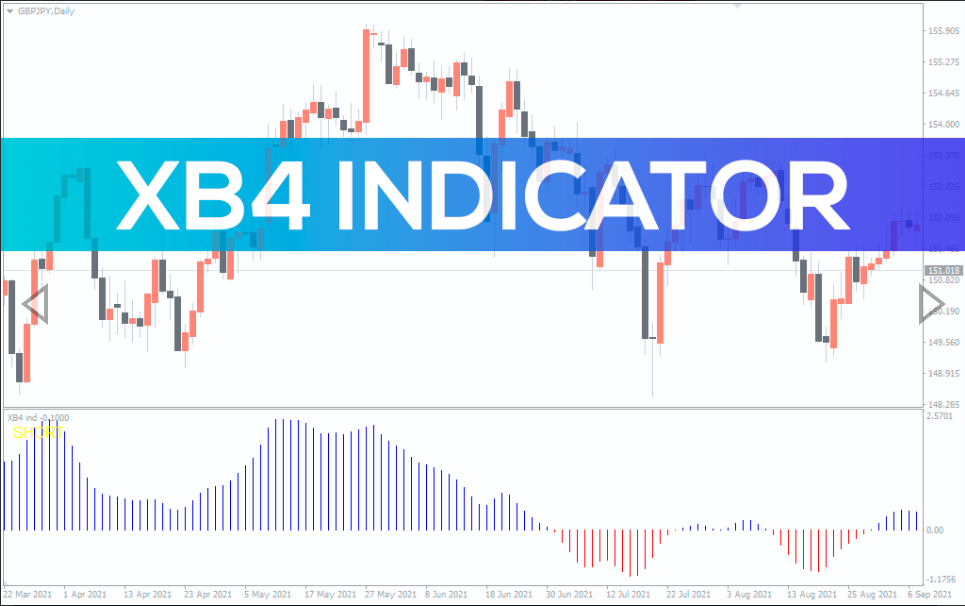
XB4 Indicator
XB4 is a simple indicator ideal for beginner traders. Suitable detector for trend reversal.
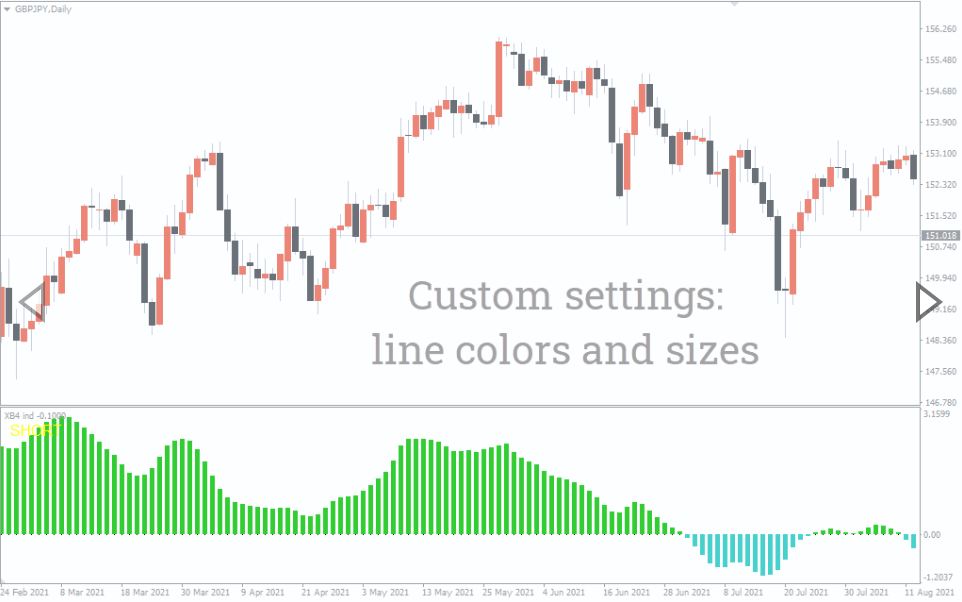
Xb4 is a straightforward and simple-to-use indicator. It is made of a histogram akin to the MACD and forms a separate window at the bottom of the chart pattern. Essentially, the indicator is divided into two by a 0-level line. The indicator forms a blue histogram above this line and a red indicator below the line.
It is an excellent indicator that both novice and experienced traders can use. You can also use the indicator for long-term and short-term trading. However, it works best in shorter time frames of 1-hour and below. What’s more, you can use the indicator to trade any currency pairs.
Buy and Sell Signals
The indicator gives an easy-to-discern buy and sell signal. You don’t have to draw or interpret lines.
A buy signal occurs when a blue histogram forms above the 0-level line. The further the histogram is from the 0-level, the stronger the uptrend.
The sell signal occurs when a red histogram forms below the 0-level line. The histogram elongates away from the 0-level line when the downtrend is strong.
An ideal time to open the trade is immediately the shift from the bottom and starts to form on the top of the line and vice versa. In other words, when it changes color from blue to red and vice versa.
Here is an interesting thing. The indicator posts a text at the left top side of the indicator window showing whether you should go short or long.
Exit strategy
Ideally, you should exit a long position when the histogram shifts from above and forms below the line. In this case, it changes color from blue to red. Similarly, you should exit the trade when the histogram changes from red to blue. In this case, the histogram below the line fades away, and stars form on the top side.
You should be cautious when the histogram forms close or oscillates around the 0-level. It indicates a weak trend that can flip at any time.
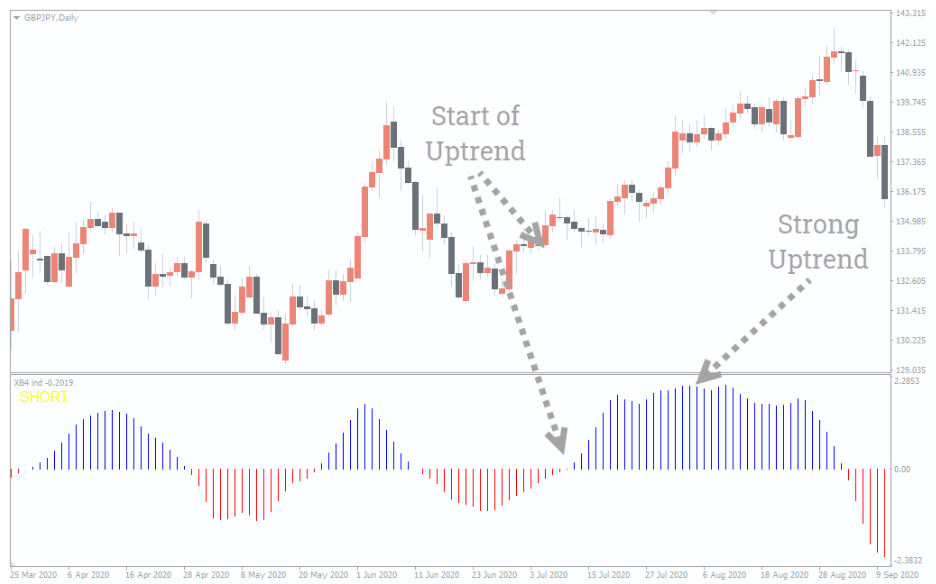
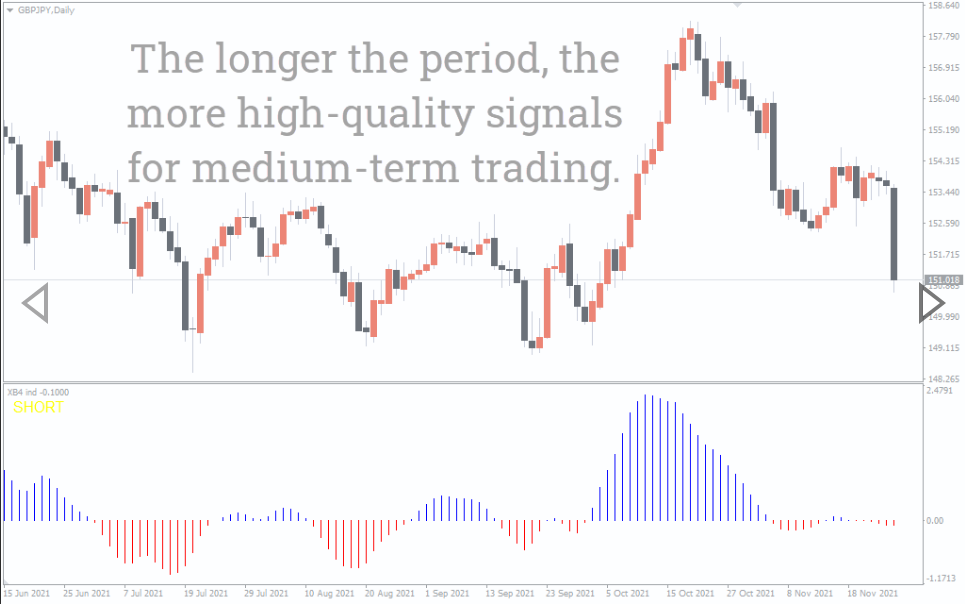
XB4 Indicator Real Chart Example
The chart above shows price movement from the Great Britain pound against the Japanese yen. The histogram changes from red to blue, forming on the upper side of 0-level. This is an indication of the beginning of an uptrend. The histogram elongates away from the 0-level, indicating a strengthening uptrend.
Notice how the indicator forms a long hill-like structure when the trend is strong. Once the hill starts sloping, it could signal an ending trend. According to our chart, the uptrend dwindles as the blue histogram ends. Eventually the indicator creates a red histogram at the lower side of the 0-level. At this point, you should close all the positions.
Conclusion
XB4 is pretty much to use and a perfect tool for newbies. Simply take the trade when the histogram changes color from blue to red and vice versa. However, you should combine it with other indicators to confirm the signal.
You must be logged in to post a review.

Copyright 2025
Reviews
There are no reviews yet.