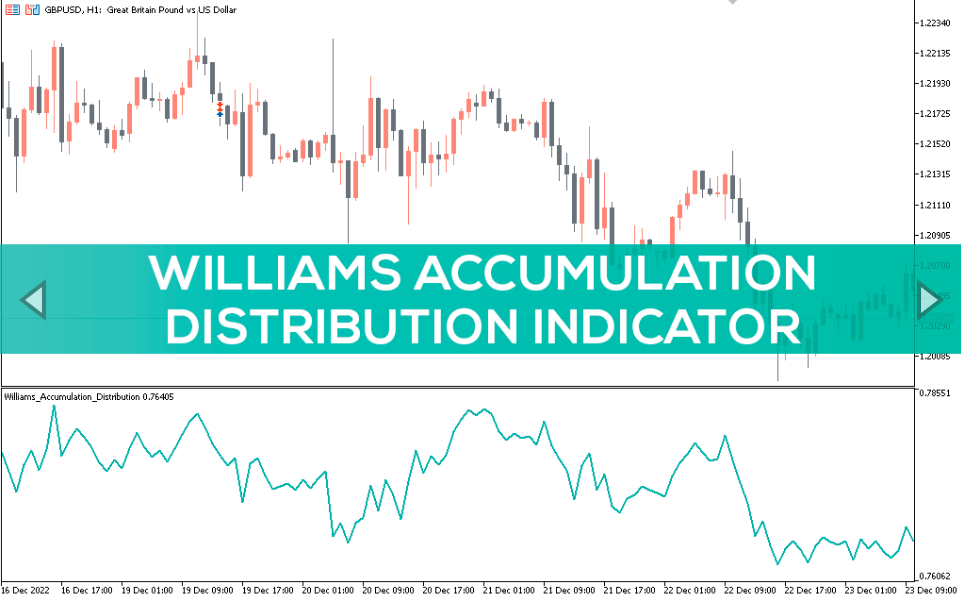
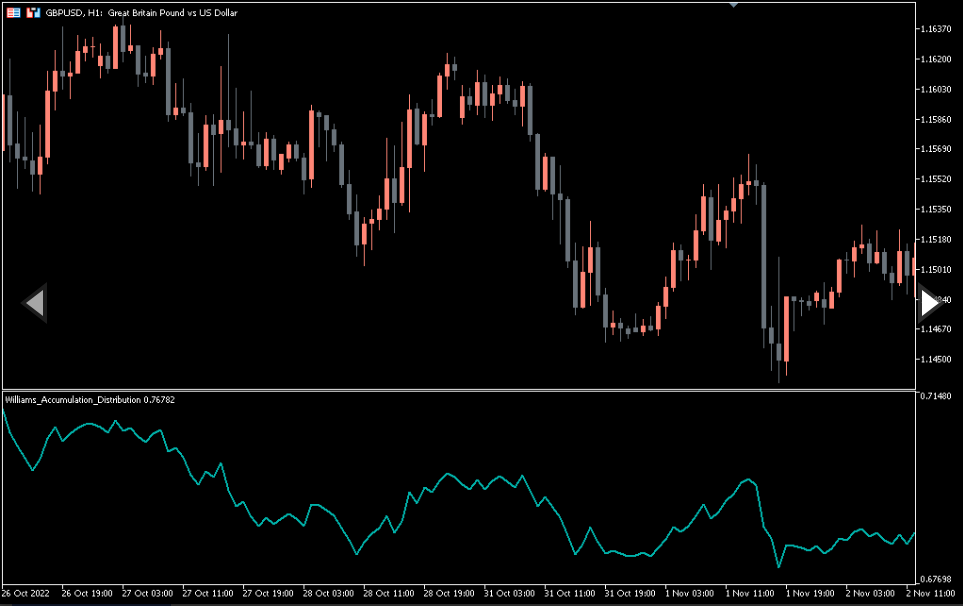
Williams Accumulation Distribution Indicator
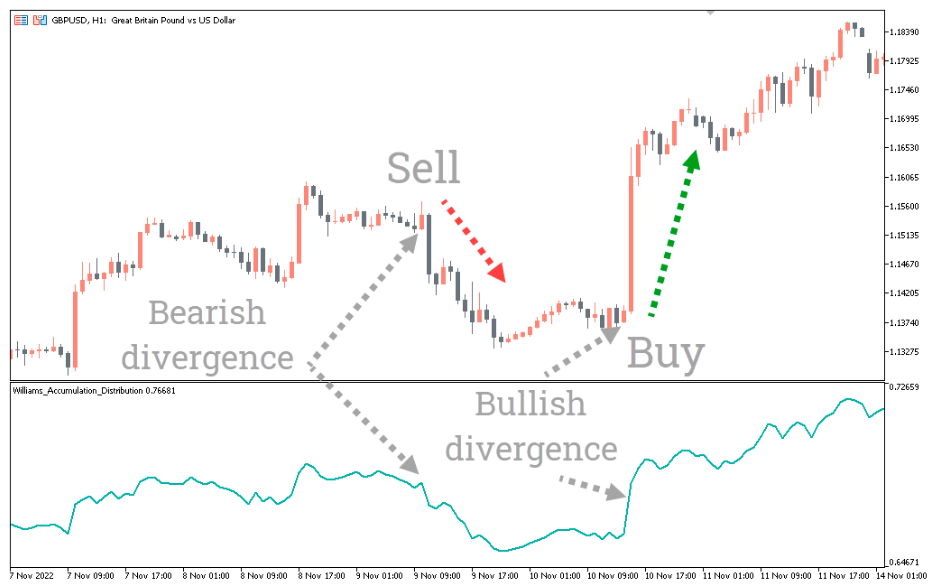
The Williams Accumulation Distribution indicator is trading on divergences between the price and the indicator line. It has a high accuracy of signals on the hourly timeframe.
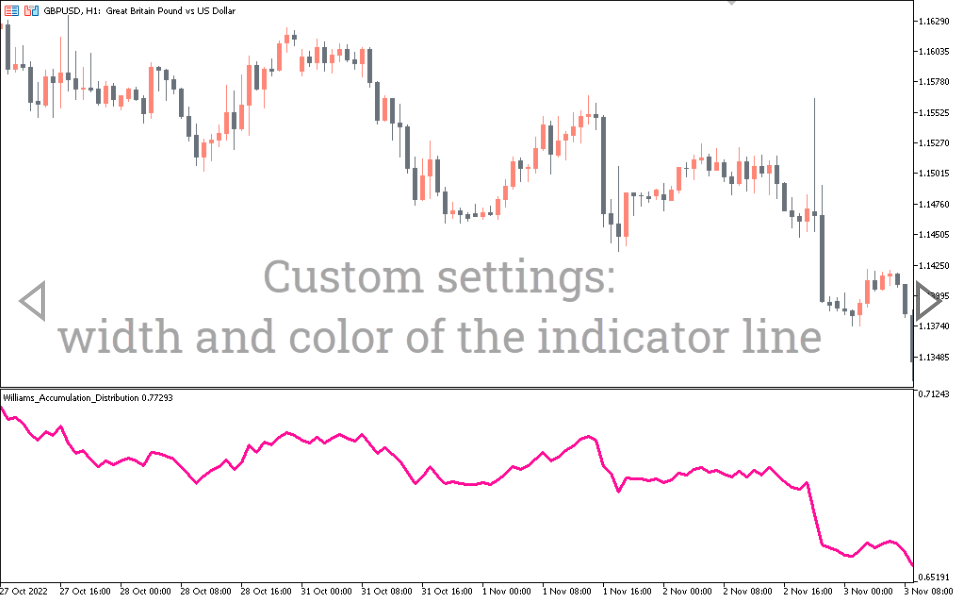
One of the best Forex trading strategies is to look for divergences between price and certain indicators. So, now I wanna show you one great indicator for such trading – Williams Accumulation Distribution Indicator for MT5.
It finds the cumulative sum of positive “accumulative” and negative “distributive” price movements in the market.
This means that you can control the maximum divergence between the observed prices and its expected values in order to infer the input to the input.
How to Trade With Williams Accumulation Distribution Indicator
The Williams Accumulation Distribution Indicator for MT5 is the basis for Chaikin’s A/D indicator and is generally similar in use. The difference is that the W_A/D calculation formula does not use trading volume.
To some extent, the indicator formula replaces candlestick analysis by showing the accumulated amount of growth for each candle. The greater the accumulated growth of candles, the greater the desire of investors to buy and the stronger the trend. For an uptrend, an increase in price is accompanied by an increase in the indicator readings. Accordingly, the price decrease also occurs in conjunction with the indicator.
If the price and indicator readings diverge, then we are dealing with divergence, a harbinger of an imminent trend reversal. This signal is most significant when the price forms a new high in an uptrend or a low in a downtrend, but this does not happen on the indicator. In this case, it makes sense to look for a reversal entry point in the near future. Divergence is the main signal of this technical analysis tool.
One of the significant disadvantages of the indicator is that it does not take into account price gaps. Near the gap, his testimony should not be trusted. Also, it doesn’t work very well on small timeframes, giving a lot of false signals. So, it’s recommended to use Williams Accumulation Distribution on charts not lower than hourly together with other technical tools and price confirmations.
Conclusion
Williams Accumulation Distribution is the sum of upward price movements resulting from accumulation and downward movements caused by the distribution of currencies, or, more simply, by selling them. Just find the divergence on your chart and open a trade. Moreover this indicator is Free to Download.
You must be logged in to post a review.

Copyright 2025

Reviews
There are no reviews yet.