Wilders DMI Oscillator Indicator
Wilders DMI Oscillator is an ideal indicator for determining trend direction. A perfect price volatility and strength detector for bull and bear markets.
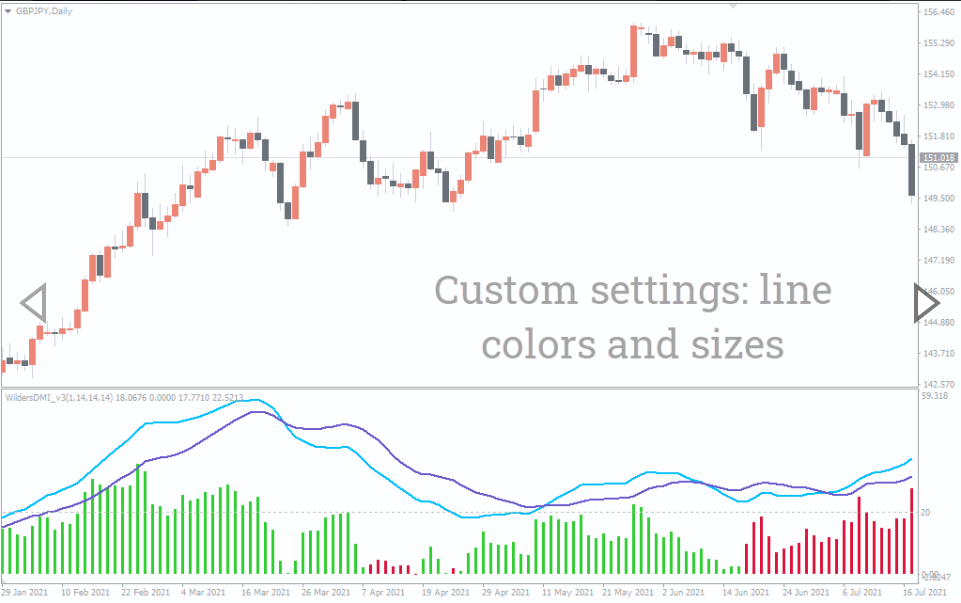
Wilders DMI Oscillator indicator measures the strength of the trend. As the name implies, it also shows the direction of the price movement. The indicator consists of two lines, a light blue line and an orange line, and bar graphs in a window below the price pattern.
The blue line or plus directional indicator (+DI) shows the price momentum is up while the minus Directional Indicator (-DI) shows the momentum is down. The lines and histogram behavior will tell you whether you should open a buy or sell signal. In fact, the oscillator goes a step further to show price volatility, giving you more reason to jump into or avoid a trade.
The indicator is ideal for both long-term and short-term, newbies and experienced traders. You can also use the oscillator o any time frame.
Wilders DMI Oscillator BUY / SELL Signals
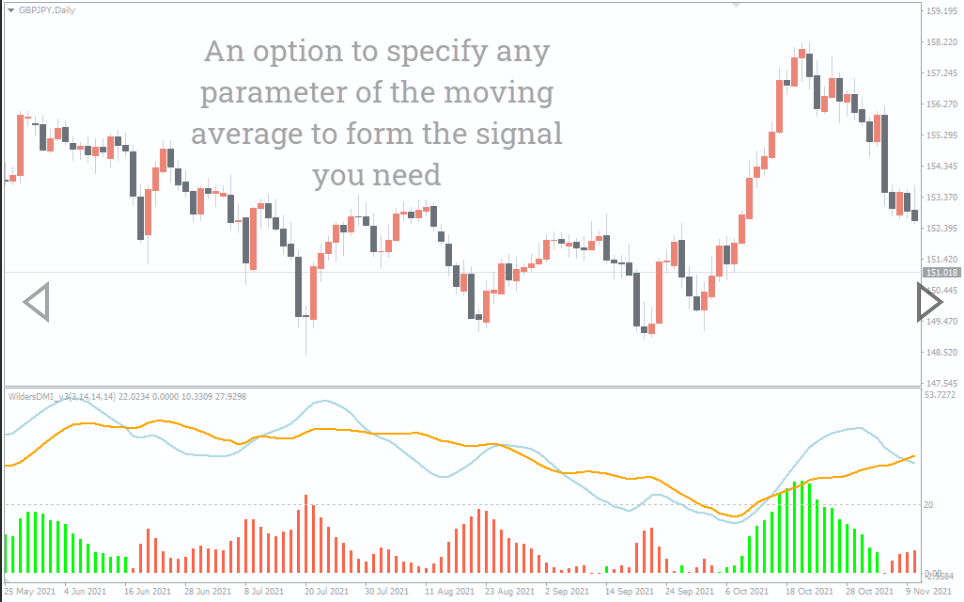
As a trader, you will want to enter when the trend is strong. So how does the indicator portray a strong trend? Simply check the histogram. When the histograms are above 20, it is an indication of an extremely strong trend.
Now, the next step is deciding whether to go long or short.
Buy Signal
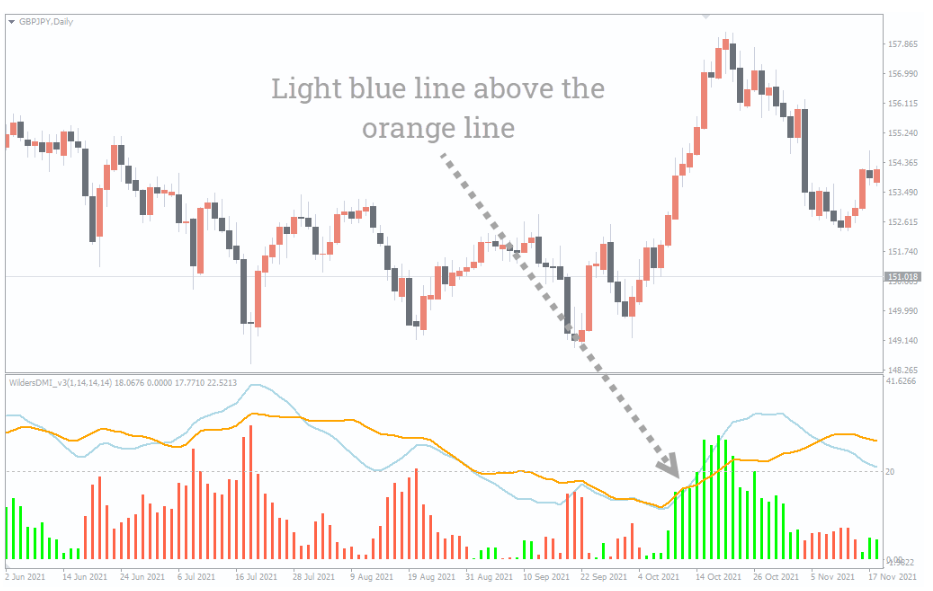
Go long when the light blue line is above the orange line. Therefore a strong buy signal occurs when the histograms are above the 20 level, and the light blue line is above the orange lines. Also, the histogram is filled with lime bar graphs when the price is on an uptrend.
Sell Signal
Open a short position when the orange line is above the light blue line. A strong sell signal occurs when the histograms are above the 20 level and the orange line is above the light blue line. The histogram is filled with tomato color when the market is in a downtrend.
You will want to exit when the two lines intersect because that is a tell-tale sign of a changing market trend.
Real Market Example
The chart above shows the price movement for Great Britain against the Japanese yen pair on a daily time frame. The grey line is above the orange line indicating the currency pair is on an uptrend. The histogram above the 20-level and lime in color, indicating a strong uptrend. All these are telltale signs of an ideal buy position. As the chart shows, the price exhibited a strong bullish movement from when the blue line crossed the orange line, as shown by the arrow.
Ideally, you should close the position when the histogram changes to the color tomato. The orange line also crosses the light blue line, indicating the beginning of a downtrend. This means you should exit the trade or get ready to enter a short trade.
Conclusions
The Wilders DMI Oscillator is a great tool for determining the price trend direction and strength. Depending on the position of the indicator lines and histogram, the trader can determine whether to go long or short. You should aim to open trades is when the histogram is above the 20 level.
You must be logged in to post a review.

Copyright 2025

Reviews
There are no reviews yet.