Weis Volume Indicator
The Weis volume indicator tells you about the direction of trends strength.
David Weis, a market analyst, developed the Weis indicator. In his book “Trades About to Happen: A Wyckoff Method,” he discussed price and volume waves in various markets.
He suggested that price and volume travel in waves rather than equal proportions.
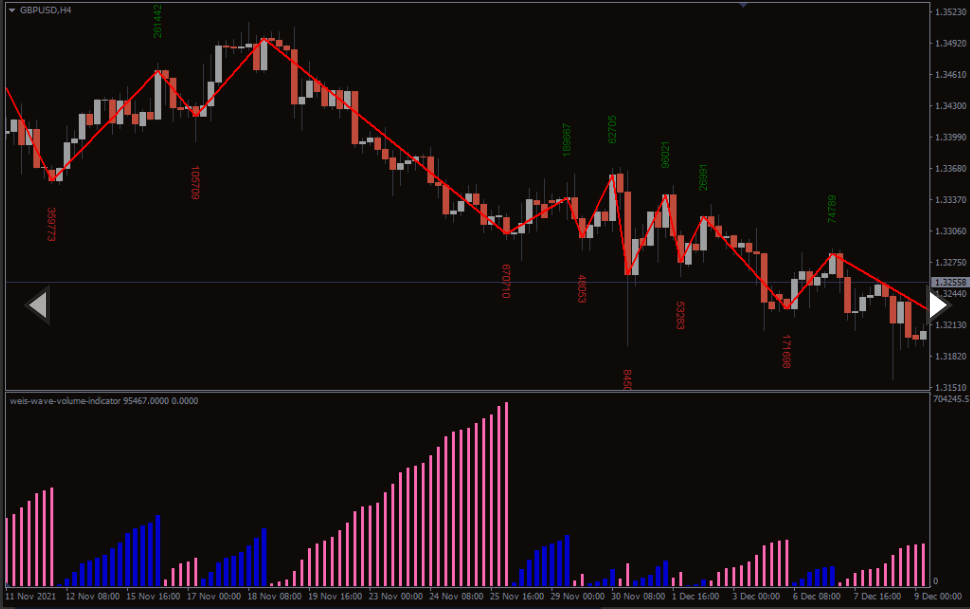
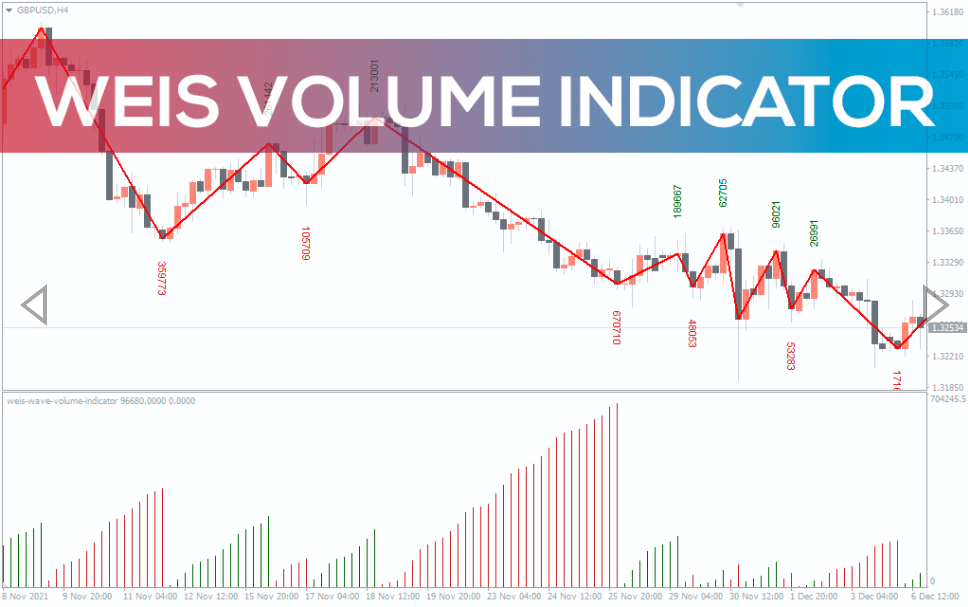
The Weis Volume indicator tells you about the trend’s direction and overall strength. The indicator comprises a wave and several bars at the bottom.
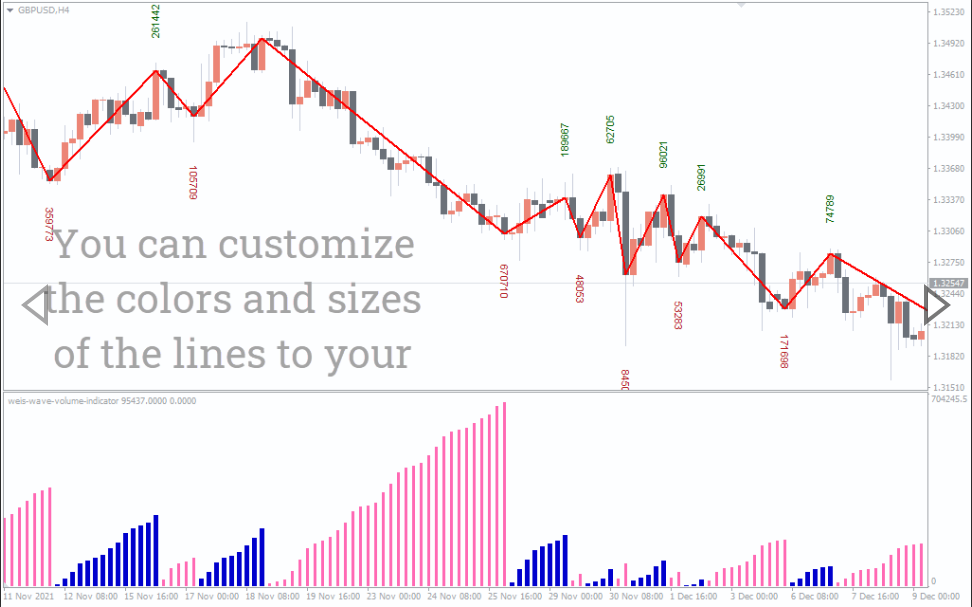
The wave paints the direction of the trend, while bars indicate the volume. Like any other volume indicator, the bars reflect a bullish and bearish trend.
When the Weis indicator plots red bars, it’s a bearish trend. On the flip side, it’s a bullish trend when the indicator draws green bars.
The indicator also illustrates numbers on the chart. These numbers suggest the volume of the bar. When the volume is low, it repaints a smaller number, while it plots a high number when the volume is high.
How to trade the Weis Volume indicator?
As a volume indicator, Weis works on the concept of supply and demand.
When the supply is high, the indicator draws green bars, and the wave is trending upwards.
Conversely, Weis pops up red bars when the demand is high and the wave is trending downwards.
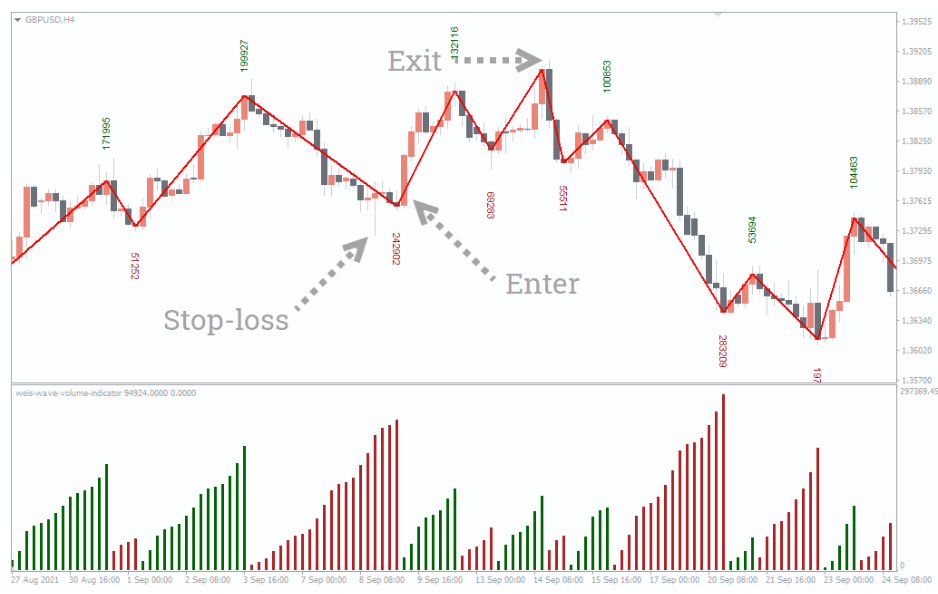
The core concept of trading with Weis is volume. When the volume is high, this is the time to enter the trades. When the indicator mentions low volume, it’s time to exit the trade.
The wave structure presents good entry and exit points. When the wave dips, it defines a good buying point, and when the indicator’s wave goes above, it’s a good selling point.
A key point to add here is to enter when the bars change their color. This is because the Weis indicator is prone to false signals. So, it’s best to avoid the market noise.
Let’s find out the buy and sell strategy for the indicator:
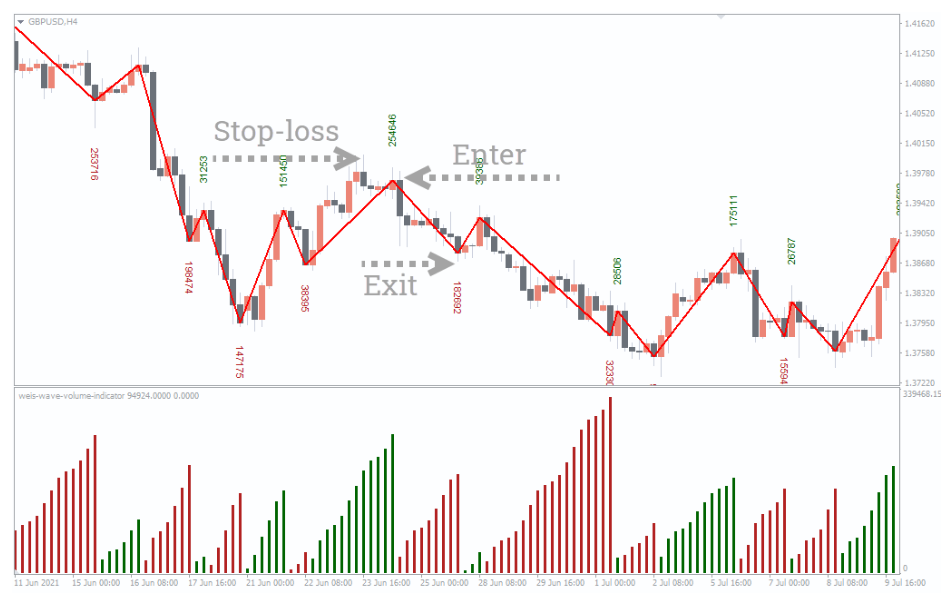
Weis Volume indicator buy strategy
Weis indicator should show a high volume.
Wait for the wave to move upwards.
Enter the trade at the green bar.
Put a stop-loss near the low of a buying point.
Exit the trade when the bar changes color.
Weis Volume indicator sell strategy
Weis indicator should show a high volume.
Wait for the wave to move downwards.
Enter the trade at the red bar.
Place a stop-loss near the high of a selling point.
Leave the trade when the bar changes color.
Conclusion
The Weis Volume indicator works best on every timeframe, but it produces less false signals on longer timeframes. For more accurate trading signals, you can combine the indicator with others like the RSI or MACD.
You must be logged in to post a review.

Copyright 2025
Reviews
There are no reviews yet.