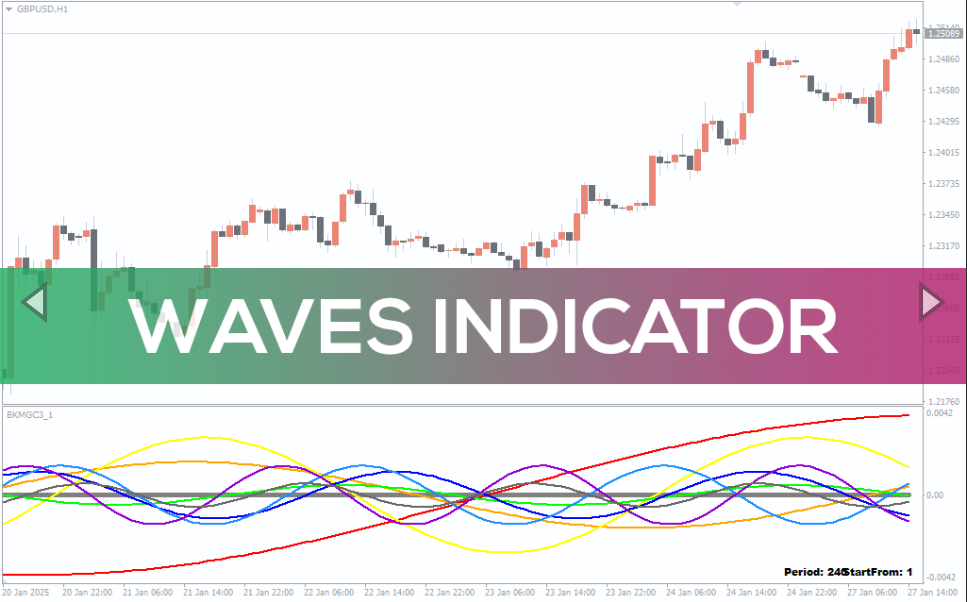
Waves Indicator
The Waves Indicator helps traders visualize market cycles with multi-colored wave patterns. Enhance your trend analysis and timing strategies with this powerful tool.
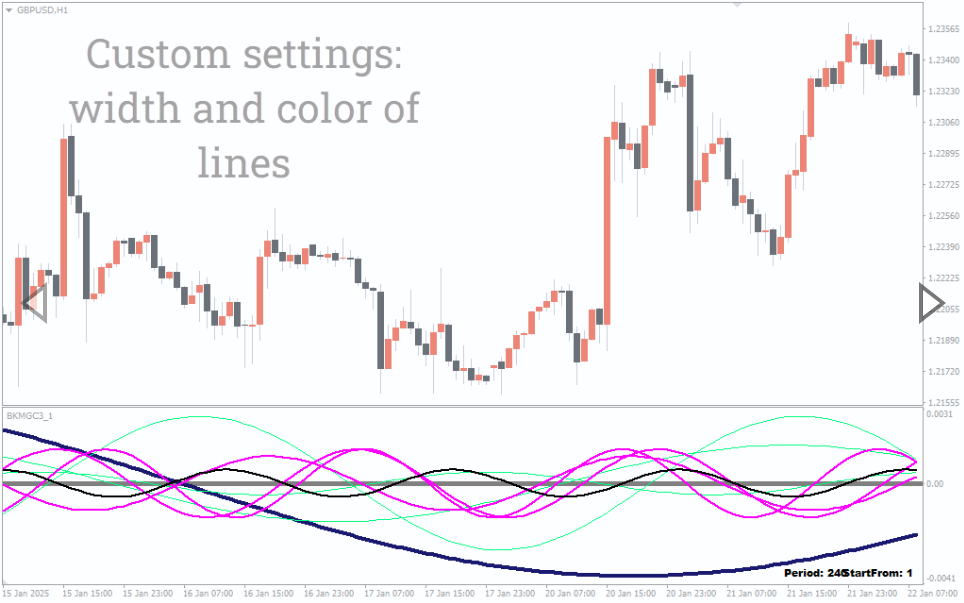
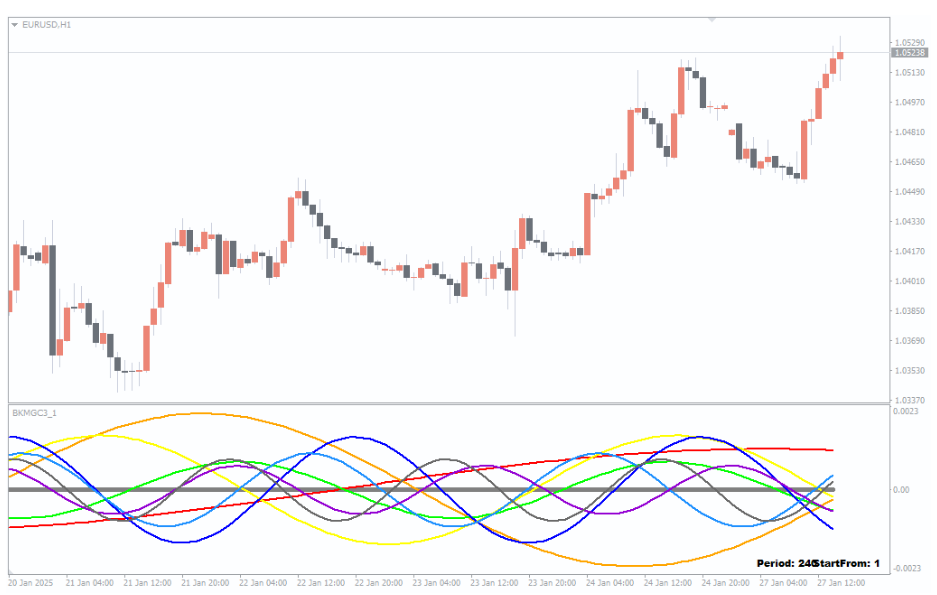
The Waves Indicator is a powerful tool designed to help traders analyze price cycles and fluctuations in financial markets. It provides a multi-dimensional view of market dynamics by displaying multiple waveforms that represent different time cycles. These waveforms allow traders to detect potential turning points, emerging trends, and rhythm patterns that influence asset prices. By using this tool, traders can gain deeper insights into market behavior and make better-informed trading decisions.
Unlike traditional trend indicators, which only track linear price movements, the Waves Indicator visualizes cyclical price actions in a dynamic format. This makes it an excellent choice for traders who rely on Elliott Wave Theory, cycle analysis, or other advanced market timing techniques. Whether you are trading forex, stocks, or commodities, this indicator helps refine your strategy by highlighting key areas of price convergence and divergence.
Waves Indicator Trading Signals
The Waves Indicator generates valuable trading signals by displaying multiple colored waveforms, each representing different market cycles. These cycles can range from short-term fluctuations to long-term macro trends, giving traders a complete perspective on market movement.
Wave Alignment: When multiple waves align in the same direction, it indicates a strong trend. If most waves are moving upward, a bullish trend is forming. If they are trending downward, it signals bearish conditions.
Wave Convergence: When several waves converge or cross at the same point, it suggests a potential reversal zone. This is useful for identifying high-probability entry and exit points.
Diverging Waves: When waves move apart from each other, it indicates increasing market volatility and potential trend exhaustion.
Rhythm and Cycle Analysis: The indicator helps traders understand repeating price cycles, allowing them to time their trades based on historical patterns.
By analyzing these wave patterns, traders can identify short-term opportunities and confirm long-term trends, making the indicator a versatile tool for different trading styles.
Conclusion
The Waves Indicator is an invaluable tool for traders looking to incorporate market cycle analysis into their strategy. By tracking wave formations and identifying areas of alignment and divergence, this indicator helps traders spot trends, reversals, and key market movements with greater accuracy.
Whether you are a swing trader seeking optimal entry points, a day trader looking for quick reversals, or a long-term investor analyzing macro trends, the Waves Indicator provides essential insights into price action.
You must be logged in to post a review.

Copyright 2025

Reviews
There are no reviews yet.