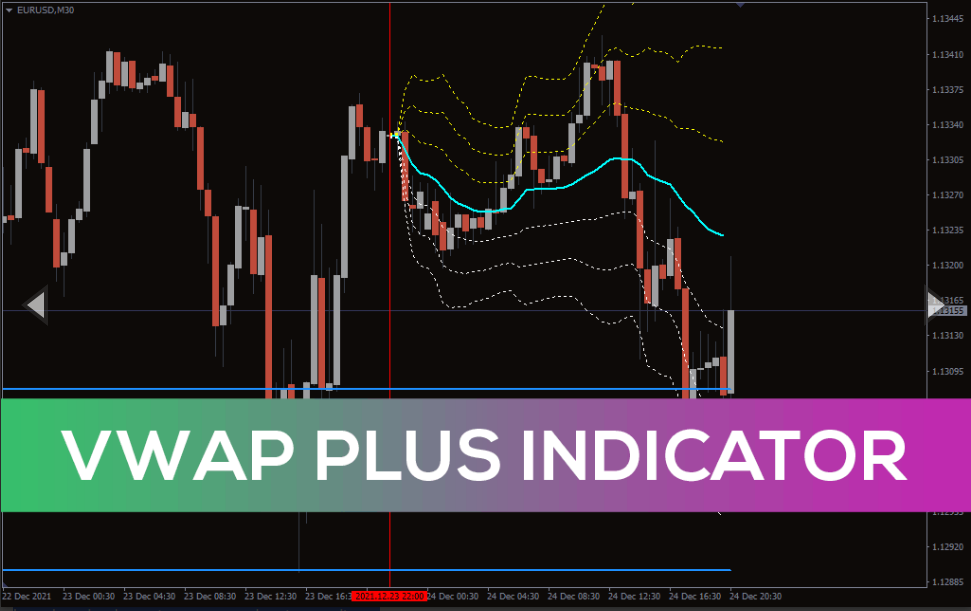
VWAP Plus Indicator
VWAP Plus indicator for MT4 provides BUY and SELL forex trading signals and dynamic support resistance levels using volume.
The VWAP Plus indicator for MT4 is a Volume Weighted Average Price indicator using volume as an integral component. The indicator provides trading signals primarily using the VWAP line. Additionally, the indicator plots dynamic support and resistance lines which are effective in trading intraday price charts. So, forex traders can use the Bullish and Bearish trading signals of the VWAP line and simultaneously use the support and resistance levels.
The indicator works well for new and advanced forex traders. New forex traders can use the indicator to identify reversal points based on the dynamic support and resistance lines.
However, advanced forex traders can use price action and other technical trading strategies to confirm price reversal. Additionally, the indicator works well in all intraday price charts as well as the daily, weekly, and monthly price charts. The dynamic support and resistance lines of VWAP perform their best in the lower time frame charts of M5, M15 and are a boon for intraday technical traders.
VWAP Plus Indicator For MT4 VWAP Trading Signals
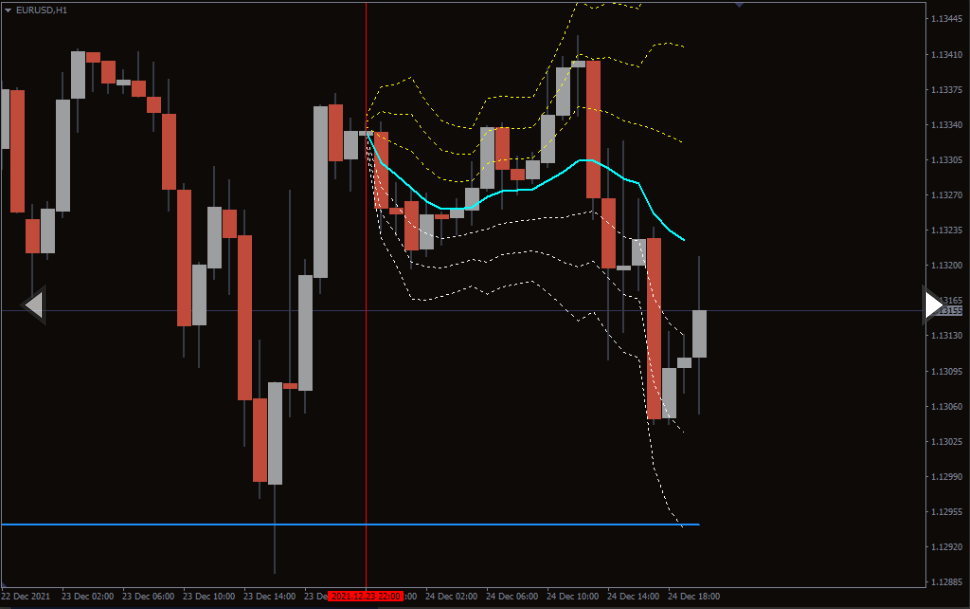
The above EURUSD H1 price chart shows the VWAP Plus indicator for MT4 in action. The indicator shows the VWAP line in AQUA and the resistance lines as YELLOW and the support lines as WHITE.
If the price crosses the AQUA line upwards it indicates a Bullish trend. So, forex traders can enter the market with a BUY position once the price closes and stays above the AQUA line. The best profit targets are at the yellow resistance lines and the stop loss is below the previous swing low.
Similarly, if the price makes a downward cross of the VWAP Aqua line it shows a Bearish market trend. So, forex traders can take a SELL trade if the price closes below the Aqua line. A stop-loss above the previous swing high and take profit targets at the white support lines are prudent.
VWAP Plus Indicator For MT4 Dynamic Support And Resistance Trading Signals
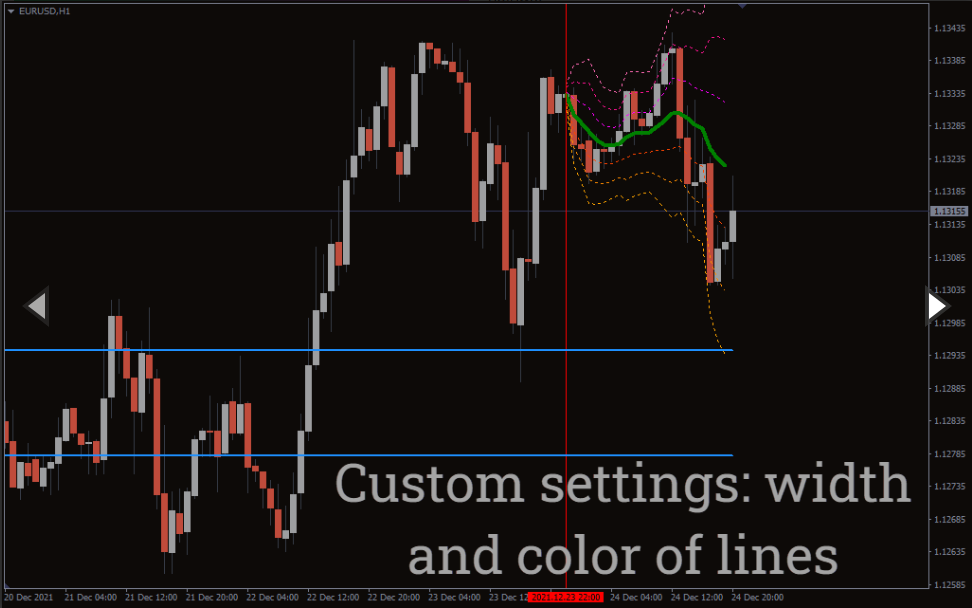
The above EURJPY M5 price charts show the dynamic support and resistance. The indicator plots these horizontal lines in BLUE.
Price tends to respect these lines as potential reversal points and works well in M5, M15 intraday price charts. If the price reaches a support line and is rejected it indicates a BUY signal. The best stop loss is at the previous swing low. Profit booking with a good risk and reward ratio is prudent.
Similarly, if the price reaches a resistance line and gets rejected it indicates a Bearish signal and is a SELL entry point. Technical traders can place the stop loss below the previous swing high and book profits with a good risk-reward ratio.
Conclusion
The VWAP plus indicator for MT4 provides multiple forex trading signals using the VWAP line and dynamic support and resistance lines. However, both type of trading signals requires confirmation of price action. So, forex traders must enhance their price action trading techniques to trade this technical strategy. Additionally, traders can download the indicator for free and install it easily.
You must be logged in to post a review.

Copyright 2025
Reviews
There are no reviews yet.