Volatility Quality Indicator NRP
Volatility Quality Indicator NRP uses the percentage of Average True Range (%ATR) to filter trade signals for better buy and sell entries, and to determine the strength of a trend.
Every forex trader loves a trending market with high volatility. In order to maximize their profit, and often avoid trading when the market is choppy to avoid false signals. Because many forex traders love a trending and highly volatile market, technical indicator. They give accurate signals when a market is highly volatile and trending are mostly used. One of the best technical indicators is the Volatility Quality Indicator.
The Foundations Volatility Quality Indicator
Volatility Quality Indicator uses the percentage of Average True Range (%ATR). This will filter out trade signals for better buy and sell entries, and to determine the strength of a trend.
This indicator, developed by Thomas Stridsman in technical analysis of stocks, is a combination of two averages; Open-High-Low-Close values of a Weighted Moving Average and Smooth Moving Average to derive its values.
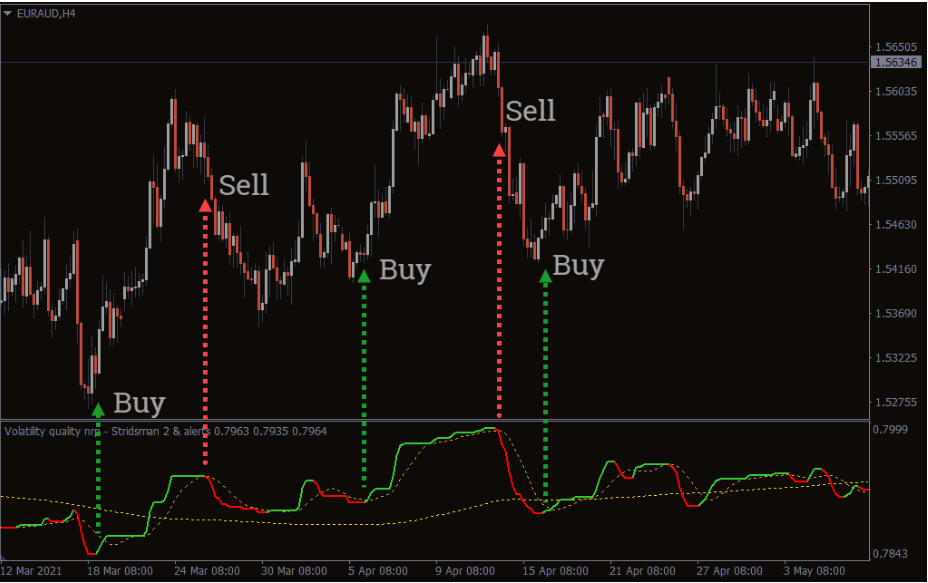
The diagram above shows the volatility meta-trader four (MT4) indicator in action on the EUR/AUD H4 chart.
This indicator turns green when the EUR/AUD H4 chart becomes bullish, and moves up progressively as the uptrend continues.
Consequently, the volatility quality indicator changes from green to red color when the chart turns from a bullish to a bearish market. And progressively moves downward as the downtrend continues. This makes this indicator a good trend-trading strategy indicator.
How to Trade Using the Volatility Quality Indicator
The Indicator can be used by range traders, breakout traders and trend traders.
Using a ranging market as an illustration, the indicator can be used solely to enter and exit a trade. Or used as confirmation signals when the price is at the support or resistance zones.
In the diagram EUR/AUD H4 chart below, the support level (aqua blue color) is found around 1.54270. The resistance level (black color) is found around 1.56242.
In the diagram above, a buy trade or long position can be taken when the price is at the support zones. In this moment the volatility quality indicator color changes from red to green. Its seen in the arrows pointing up on the volatility quality indicator lines, and the buy alert on the chart. The long position can be closed when the price is at the resistant point. Wherein the volatility quality indicator changes color from green to red.
Consequently, a sell trade or short position can be taken when the price is at the resistance zones. In this moment the volatility quality indicator color changes from green to red color. Its seen in the arrows pointing down on the VQ indicator lines, and the sell alert on the chart. The short position can be closed when the price is at the support level. Wherein the indicator color changes from red to green.
Conclusions
The volatility quality indicator offers a wide range of advantages. It should be used when the market is trending with high volatility or for news trading. This indicator works in all time frames (monthly, weekly, daily, hourly and minutes time frames) and can be used for suitable for swing trading, intraday or day trading, and for scalping purposes.
You must be logged in to post a review.

Copyright 2025
Reviews
There are no reviews yet.