Vertex Indicator
Forex volume analysis from the best Vertex Indicator for MT4. Identify the trend’s strength through volume analysis.
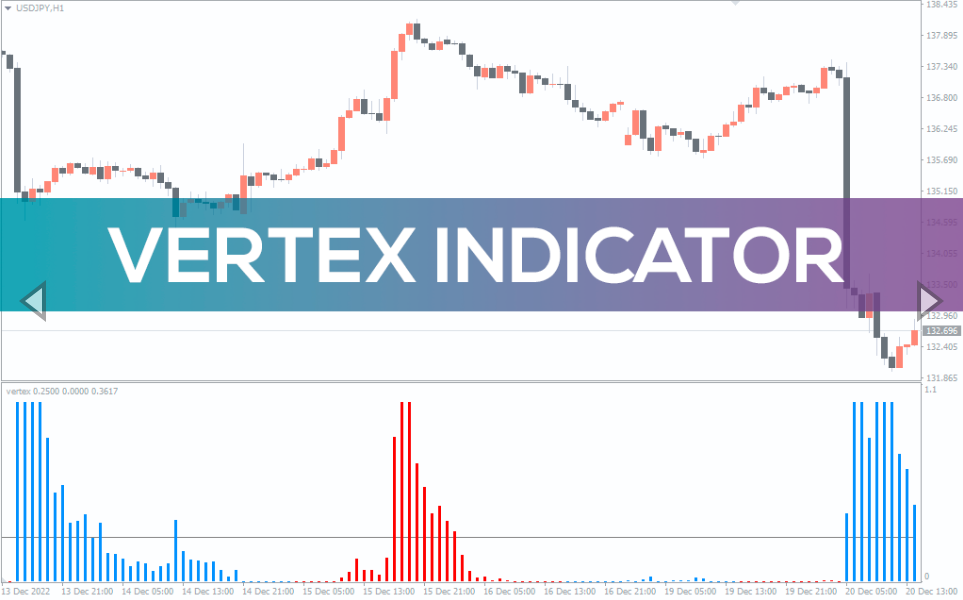
The Vertex Indicator is a simple MT4 indicator that shows trend momentum through volume.
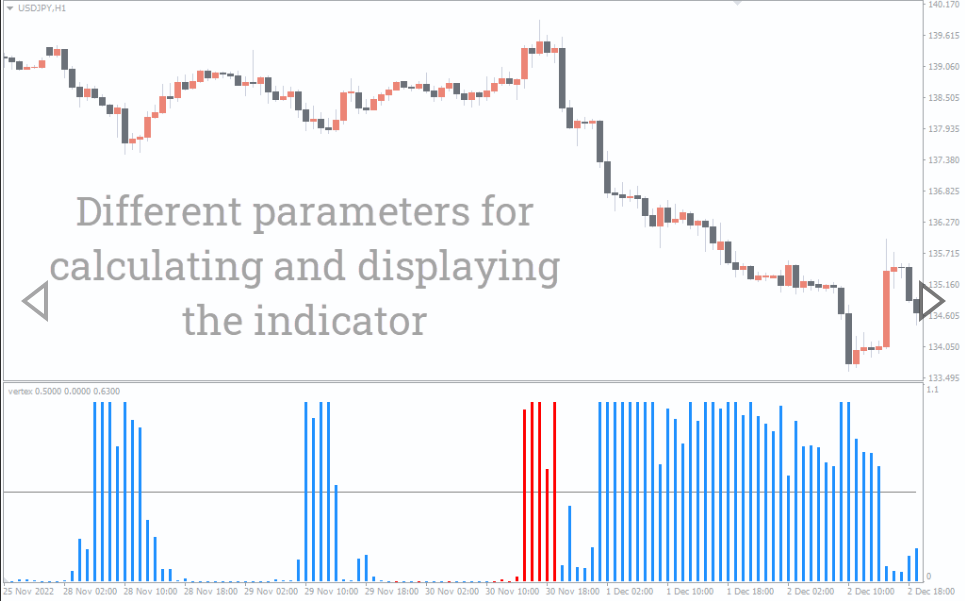
The indicator ranges between 0 and 1.1 and plots red and blue bars to mention the buying or selling volume. The blue bars represent the selling volume, while the red bars mention the buying volume.
By looking at the volume, you can find the trend’s strength and take positions accordingly.
The Vertex Indicator works on any timeframe, but it’s better to set it on longer timeframes to reduce false signals.
How to use the Vertex Indicator for MT4?
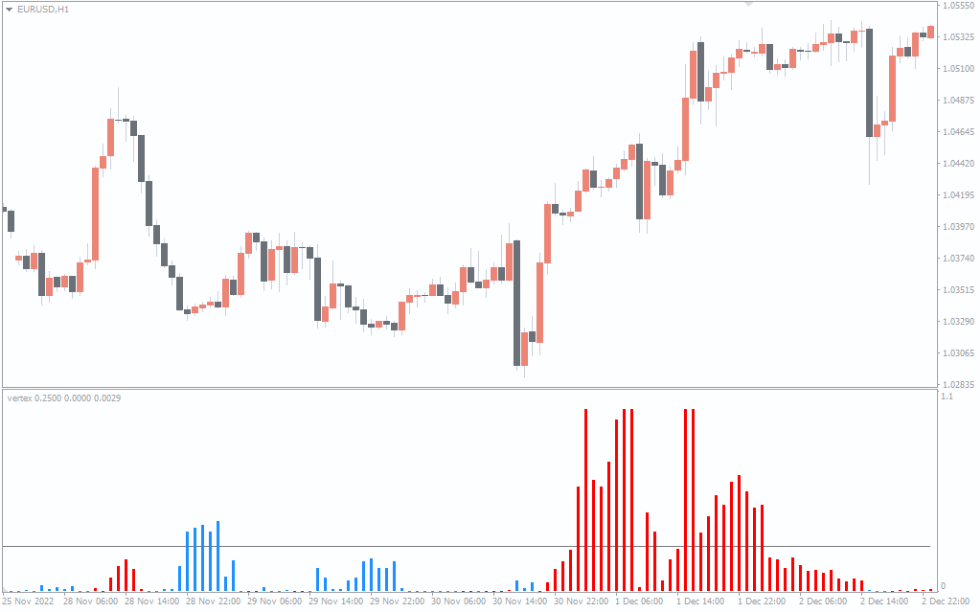
The above H1 EUR/USD chart shows the Vertex Indicator on the chart.
The indicator doesn’t give BUY and SELL signals; rather, it tells the volume. When the blue bars appear, it means that there is selling pressure, and the overall trend is downwards.
Conversely, when the red bars pop up, it means that there is a buying volume and the overall trend is upwards.
One thing to note here is that the larger the bars are, the more strength the trend will be. Also, when the indicator goes above the line between 0 and 1.1, there is a strong volume.
Conclusion
The Vertex Indicator tells about the market volume by plotting blue and red bars. By locating the bars, and the rules mentioned above, it can become a good secondary indicator for your strategies.
If you want, you can download the indicator for free on our website.

Reviews
There are no reviews yet.