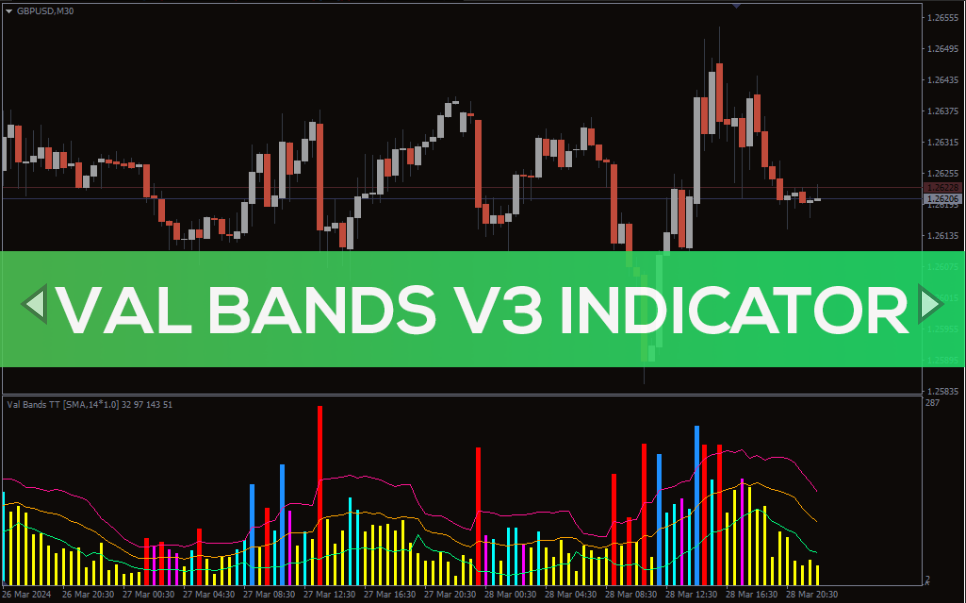
Val Bands V3 Indicator For MT4 provides buy and sell forex trading signals using candle length. The histogram bars indicate flat, bullish, bearish trends.
The Val Bands V3 indicator for MT4 measures the length of candles and plots a Bollinger band using the candle length. The candle length is depicted as histogram bars with a Bollinger band on the histogram. This indicator shows the forex traders a flat market and the beginning of a bullish or bearish trend.
The indicator is simple to use with a colored histogram and is suitable for new and advanced forex traders. Furthermore, traders can apply this indicator on all chart time frames.
Val Bands V3 Indicator For MT4 Trading Signals
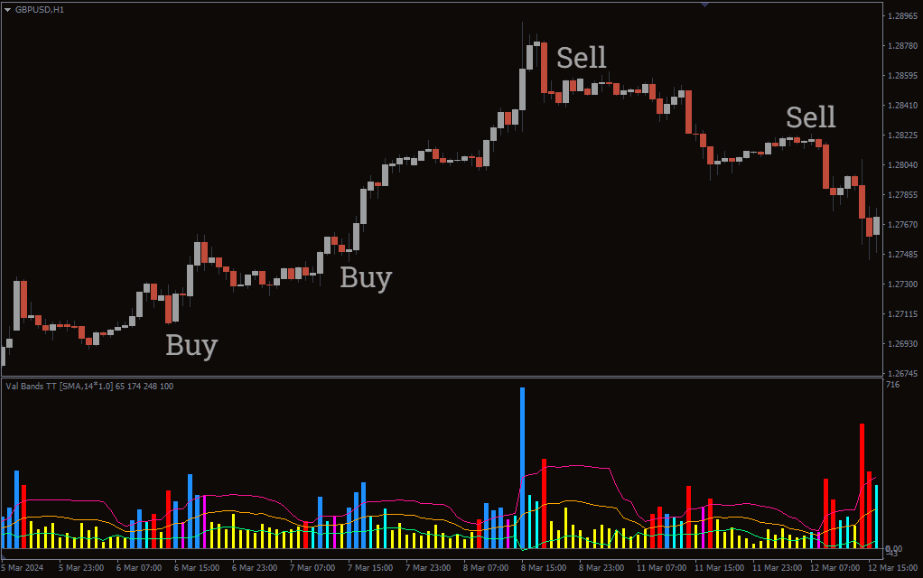
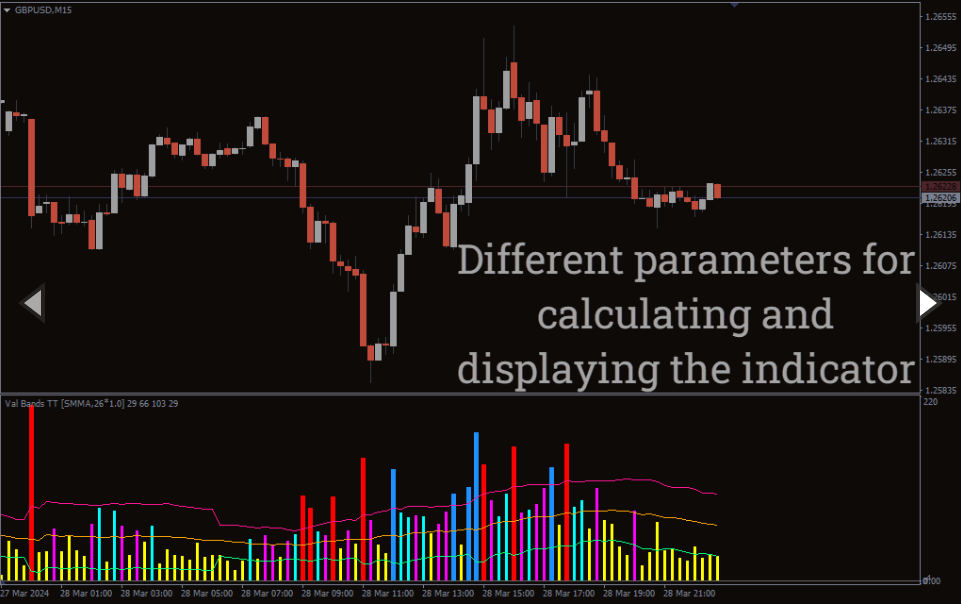
The indicator plots multi colored histogram bars for easy identification. Yellow histogram bars indicate a flat or neutral market. Red indicates a bearish trading signal and Blue is a bullish trading signal. Additionally, the three lines indicate Bollinger bands calculated using the candlestick length.
If the histogram bars are below the Bollinger bands, it is neutral market trend. However, if the histogram bars start moving from the lower Bollinger band and go beyond the upper band it indicates the beginning of the trend. Such candles are in Red and Blue, so traders should focus on the appearance of these candles.
The trading strategy is to enter the markets with a buy trade as soon as the first Blue histogram bar appears. Traders can place a stop below the previous swing low and exit with profits at an opposite signal.
Similarly, traders can open a sell position if a red histogram bar appears using the above stop loss and take profit strategy.
Conclusion
In summary, the Val bands V3 indicator for MT4 is an essential trading tool for forex trader using candlestick length for technical analysis.
Reviews
There are no reviews yet.
Be the first to review “Val Bands V3 Indicator” Cancel reply
We use cookies to ensure that we give you the best experience on our website. If you continue to use this site we will assume that you are happy with it.Accept

Reviews
There are no reviews yet.