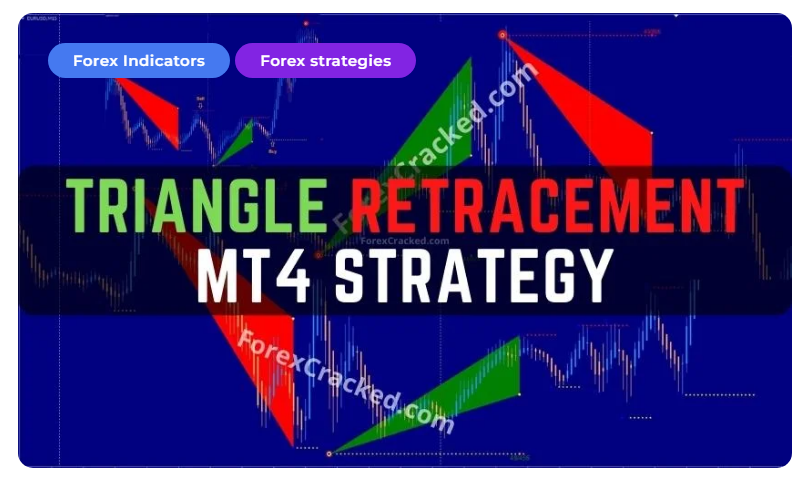
Triangle Retracement MT4 Strategy
The Triangle retracement Strategy For MT4 is not a price action strategy that depends on triangle chart patterns that most traders interpret as an indication of a trend continuation. Instead, it is based on the ZigZag indicator that is standard in the MT4 platform.
This strategy will use a modified version of the MT4 ZigZag indicator, the “Zig zag 2vf“. This variant of the standard indicator offers more visualization. Instead of tracing price movement via a line, it connects three points and draws a triangle filled in either blue or red color.
In addition to that, it also shows whether the larger trend is either up or down based on the bar count parameter.
And the basis for using the indicator is the conception that price returns to the triangle’s middle point (marked by the yellow point), hence “Triangle Retracement.” This tendency for price to return at that point opens a trade entry for this system.
As opposed to solely basing the completion of the triangle on finding an entry, There are three other tools in this system necessary to trade Chaos Semafor, the Buy and Sell, and the Heiken Ashi MA T3 indicator.
The Chaos Semafor is an indicator showing the chart’s pivot points. It displays either green or red circles, marking bullish or bearish shifts in price direction.
Next, the Buy and Sell indicator shows significant support and resistance levels in the current timeframe. This sometimes may coincide with the pivot points established by the Chaos Semafor, which is helpful for confirmation. And the Heiken Ashi indicator, much like the ZigZag indicator, is just another way of filtering noise.
Triangle Retracement MT4 Strategy Trading rules
Buy signal
A green triangle is drawn on the chart
Heiken Aschi MA T3 blue bar. (optional)
Retracement of price close or slightly past the triangle’s middle line (yellow point)
A proper Buy setup is in play if the price bounces off above mentioned yellow point area and is supported by a Yellow dotted line from the Buy and Sell indicator.
Sell signal
A Red triangle is drawn on the chart
Heiken Aschi MA T3 Orange bar. (optional)
Retracement of price close or slightly past the triangle’s middle line (yellow point)
A proper Sell setup is in play if the price bounces off above mentioned yellow point area and is resisted by a Red dotted line from the Buy and Sell indicator.
You must be logged in to post a review.

Copyright 2025
Reviews
There are no reviews yet.