Trend Reversal Indicator
A perfect indicator for providing superb sell and buy signals. Free Download. An excellent trend reversal detector for effortless identification of ideal trade entry points.
The trend reversal indicator is an oscillator based on two exponential moving averages. The indicator opens up on a separate window below the price chart. The buy and sell signals are triggered when the slow and fast-moving exponential moving average intersect. It is an excellent indicator for identifying trend reversal.
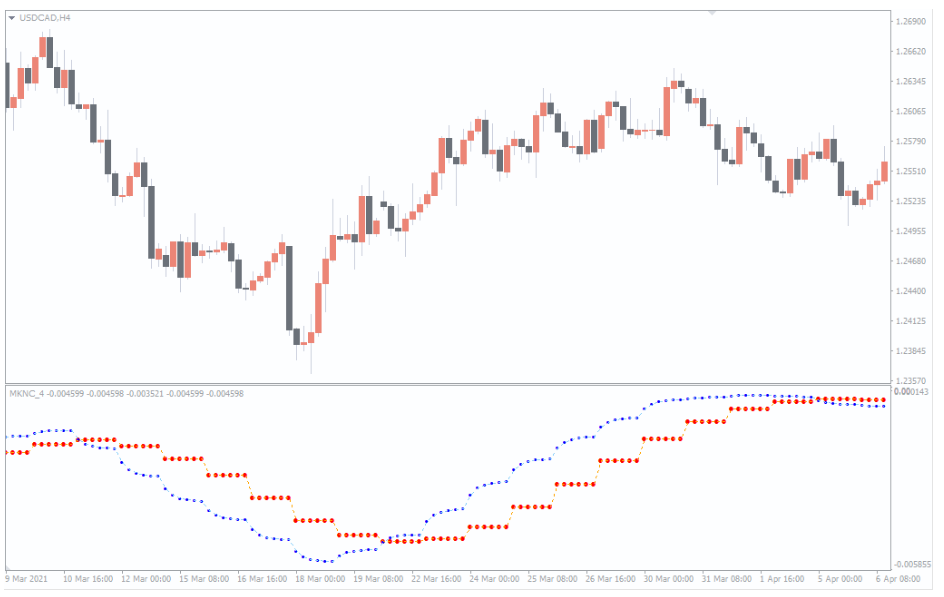
The trend reversal indicator for MT4 is perfect for day trading and scalping. You can use the indicator on all time frames ranging from 1-minute to 1-month. However, the indicator works best on higher time frames such as H4 (four hours). Otherwise, you risk getting multiple fluctuations on shorter time frames, which could result in small losses that can significantly eat on your portfolio.
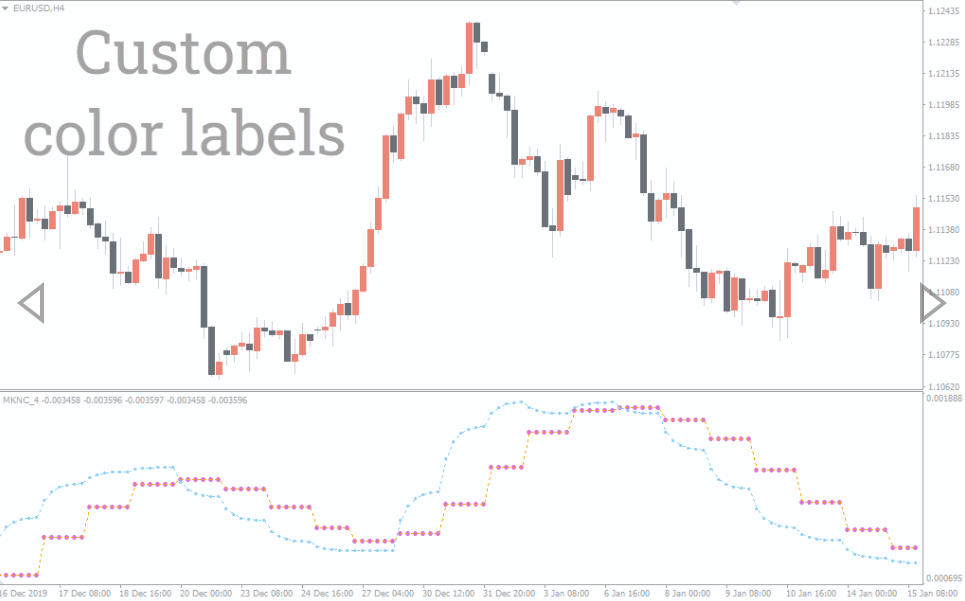
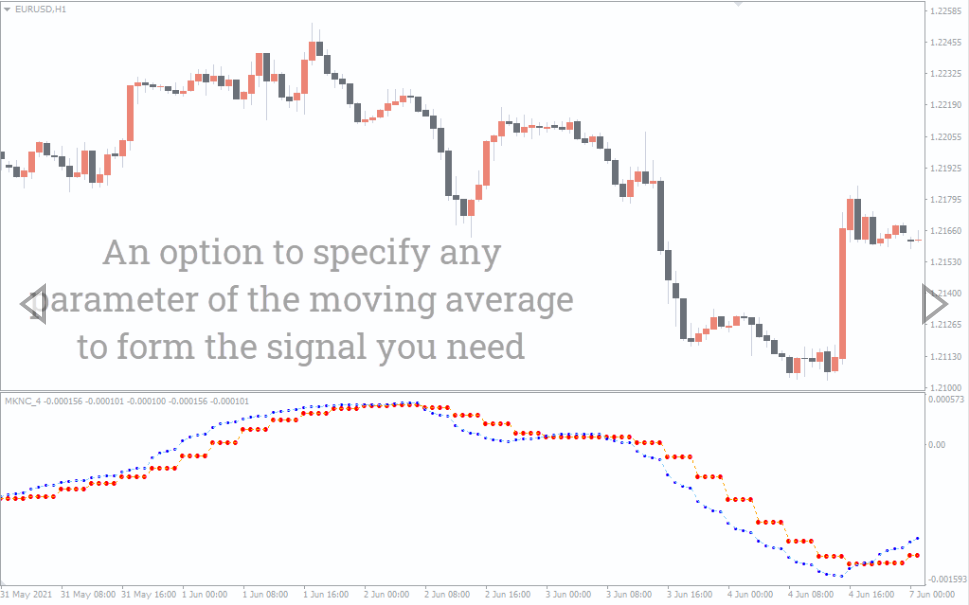
Here is an interesting point. Reading the indicator is pretty much simple. All traders whether, newbies or professionals, long-term traders or scalpers, can benefit from this indicator. What’s more, you can use the indicator to trade any pair. It also allows you to change the EMA periods on the input tab to suit your trading strategy.
It is worth noting that the indicator may provide numerous signals when the price is consolidating. Therefore, it is imperative to incorporate other indicators and analyses in your strategy to boost your profit ratio.
Buy Signal
A buy signal is generated when the fast EMA cuts above slow EMA. Put differently, the blue dotted line intersects the red line. Ideally, you should enter the long position at the opening price of the next candlestick.
So, when should you close the long position? You can exit the trade according to the preset risk to reward ratio. Alternatively, you can exit the trade when a sell signal nullifies the bullish price movement.
Sell Signal
Now, when do you enter a bearish trade?
When the red line cuts above the blue line, it is a tell-tale signal of a beginning downtrend. Therefore, you should initiate short positions. Ideally, you should enter the trade at the open of the following candlestick.
You can exit the trade after the trade hits the set loss or reward. Also, you could wait for the indicator to initiate a bullish signal and exit the trade.
Setting the stop loss
An ideal stop loss is set a few pips below the support level. For sell trades, you can set the stop loss a few pips above the recent swing high.
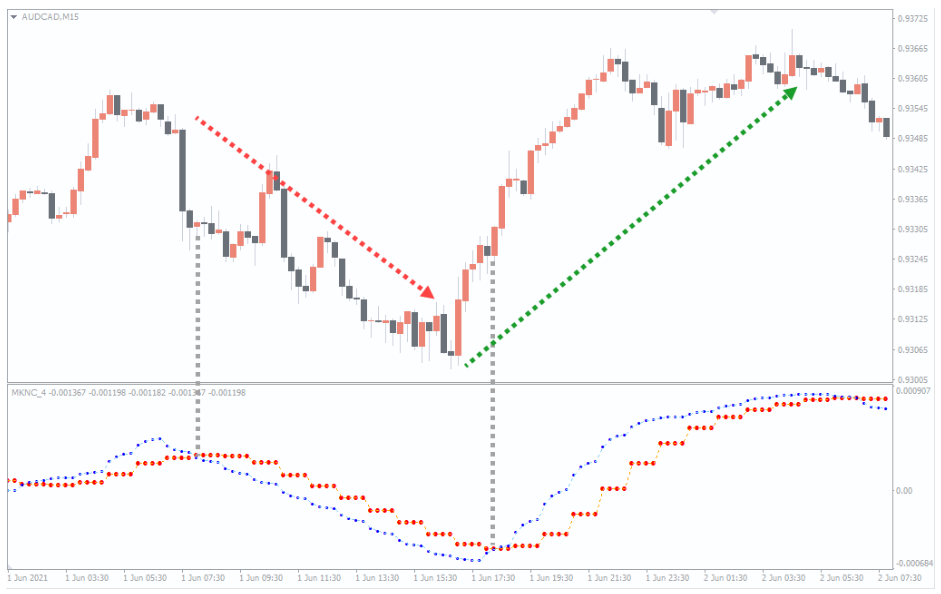
The chart above represents a price movement for AUDCAD. The red line crosses above the blue line at 0.93314 around 08:00 on June 1st. Therefore, the open of the next candle was a perfect entry point for the sell signal. You can exit the trade when the blue line crosses over the red line.
The blue line crosses over the dotted red line later in the day at 18:15, signaling a bullish signal. The price moved about 30 pips before the indicator shows another bearish signal. An excellent stop loss should be set a few pips below the recent swing low of 0.9304 for the buy trade. For the short position, the resistance zone around 0.9370 acts as a perfect stop loss.
Closing Note
A trend reversal indicator is an excellent tool for identifying potential price reversal points which act as buy and sell signals. The best part is that the signals can be used on any time frame and forex pairs. Reading the signal is pretty much straightforward, meaning that seasoned and rookie traders easily read the signal.
You must be logged in to post a review.

Copyright 2025

Reviews
There are no reviews yet.