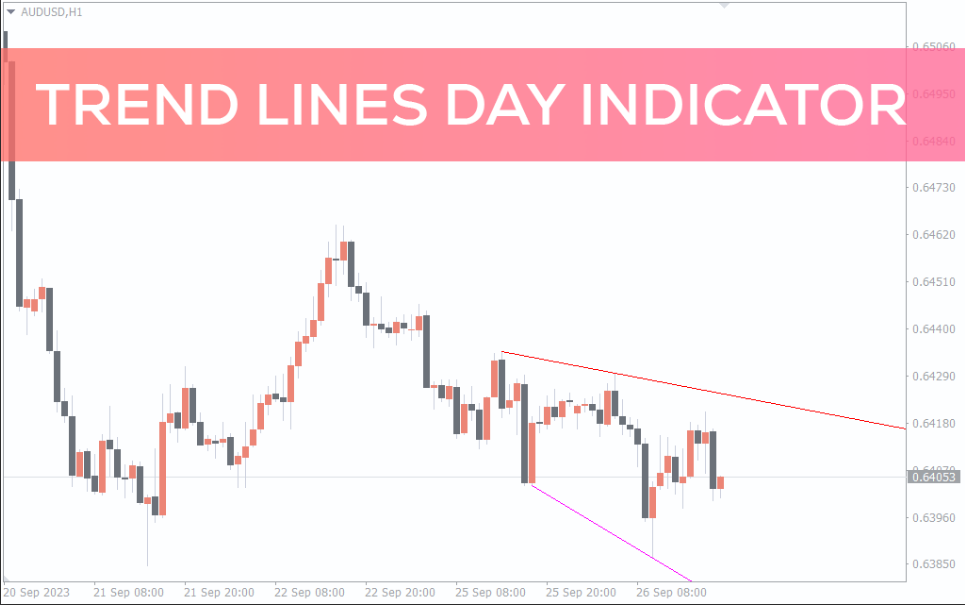
Trend Lines Day Indicator For MT4 automatically plots two trend lines on the forex price chart and acts as support and resistance
The trend lines day indicator for MT4 plots two trend lines on the price chart that act as support and resistance. This helps forex traders to identify the best trend line based support and resistance automatically and focus on the trade setup. Traders can use this indicator to enter using rejection or breakout trading strategies.
Most new forex traders fail to plot the trend lines properly and place them in the wrong highs and lows. The indicator is helpful for new forex traders as it plots the trend line automatically removing subjectivity. Advanced forex traders can use this as a guide to identify the support and resistance. Moreover, this indicator does not repaint and plots the trend lines on all chart time frames.
Trend Lines Day Indicator For MT4 Trade Setup
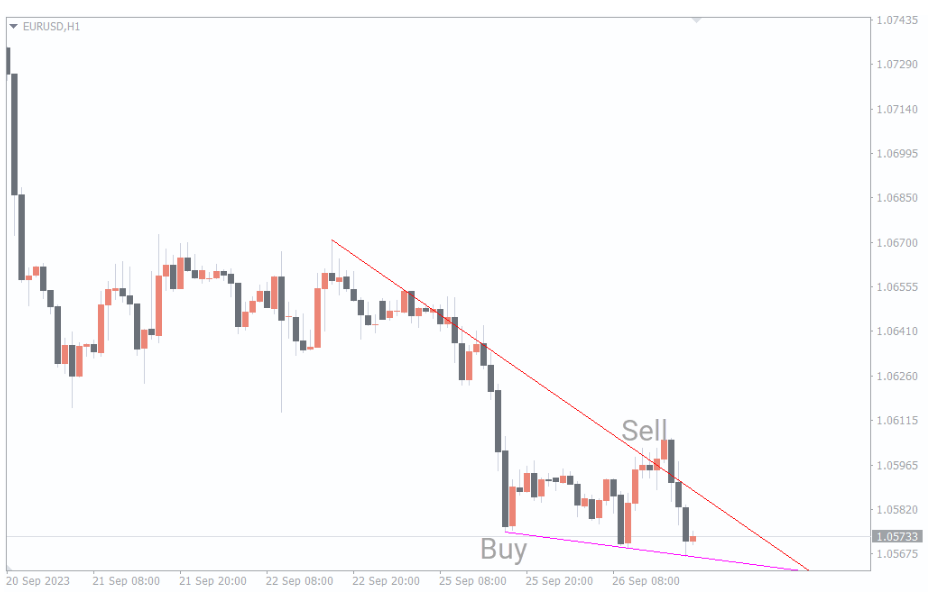
The indicator plots a red upper trend line or resistance line and a majenta lower trend line or support line. The trading strategy is based on the price action that results in rejection or breakout of these trend lines. It is important; traders should use price action to confirm the breakout or rejection before entering a trade.
Traders should enter a buy trade if price breaks the resistance with a stop loss below the previous swing low. Conversely, if the price fails to break the resistance and is rejected it would lead to a sell position.
Similarly, if the support is broken traders should enter a sell position, on the other hand if is rejected a buy trade is warranted. The indicator does not provide a take profit target so traders should exit with a good risk reward ratio.
Conclusion
In summary, the trend lines day indicator for MT4 helps support and resistance based forex traders to identify the best entry points.
Reviews
There are no reviews yet.
Be the first to review “Trend Lines Day Indicator” Cancel reply
We use cookies to ensure that we give you the best experience on our website. If you continue to use this site we will assume that you are happy with it.Accept

Reviews
There are no reviews yet.