The Trend Force Indicator plots a histogram in the data window. It shows the trend and its strength.
The Trend Force Indicator shows you a histogram, something similar to MACD. The indicator oscillates around the zero line. The indicator’s primary purpose is to determine a trend’s strength.
Different colors make it easier for traders to find whether it is worth entering or holding a position.
You can use the tool on the 4-hour chart and higher timeframes.
How to use the Trend Force Indicator for MT4?
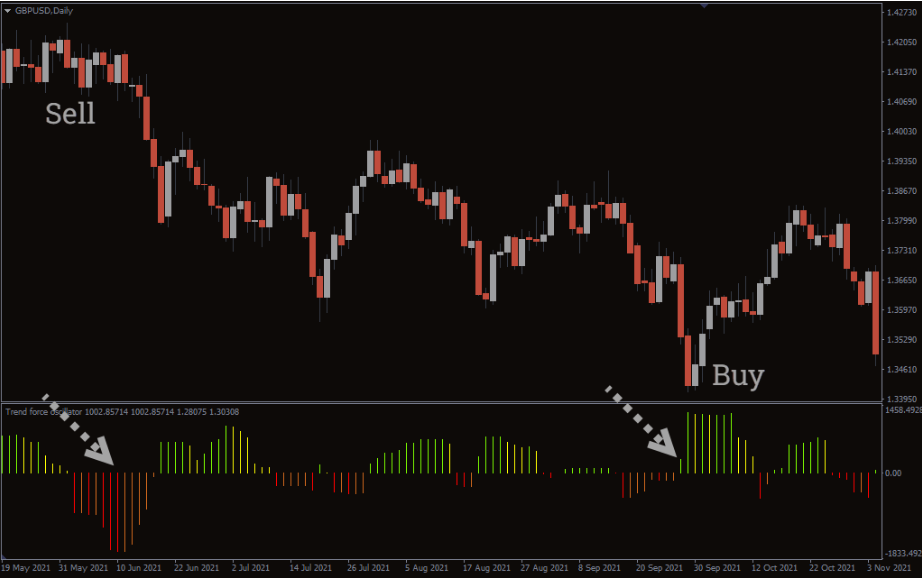
The above daily GBPUSD chart shows the BUY/SELL signals of the indicator.
The Trend Force is based on the Average True Range indicator. You can look for a long entry when the histogram moves above the zero line. Conversely, find a short entry when the histogram moves below the zero line.
However, you should not blindly take positions on the zero line only. Make sure, the candlestick must close as a bullish one if you are looking for a long entry. You can exit the position in profit when the indicator bars start declining, and the color is yellow.
Similarly, you must wait for a bearish candle to close after the indicator turns red below the zero line. The change in color from red to chocolate shows the loss of bearish strength, and you can exit.
Conclusion
The Trend Force Indicator for MT4 is based on Average True Range. You can use it in a 4-hour timeframe and higher. You should perform backtest to understand dealing with false signals.
Reviews
There are no reviews yet.
Be the first to review “Trend Force Indicator” Cancel reply
We use cookies to ensure that we give you the best experience on our website. If you continue to use this site we will assume that you are happy with it.Accept


Reviews
There are no reviews yet.