Trend Finder Indicator
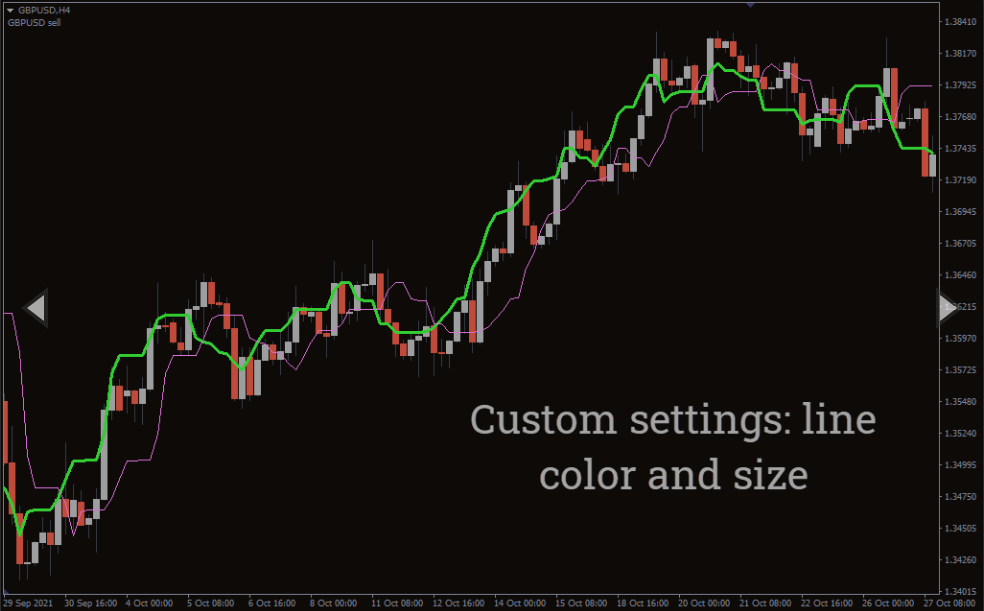
The Trend Finder indicator paints two lines to tell you the overall direction of the trend.
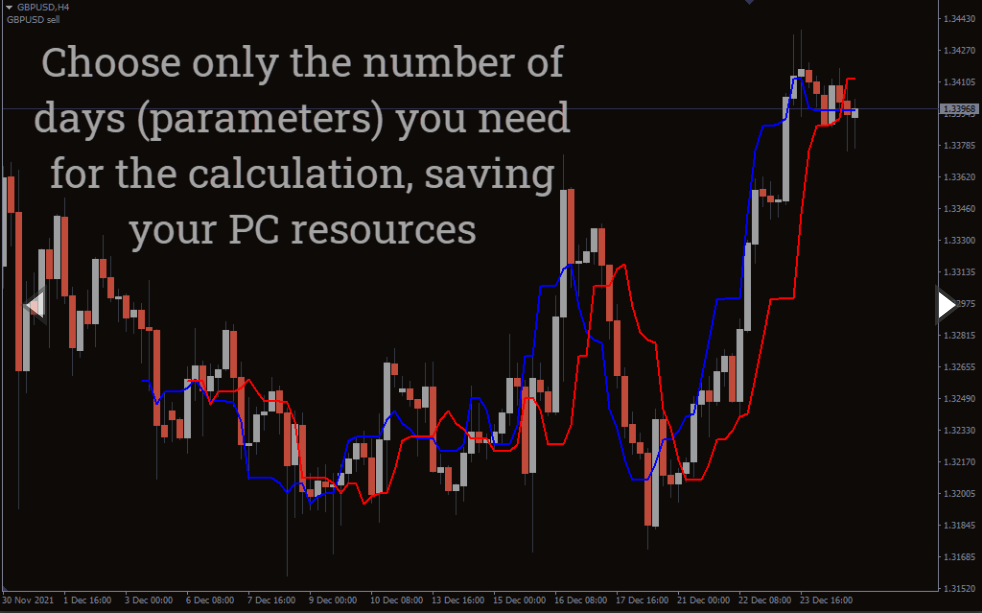
The Trend Finder indicator plots two lines on the chart to tell you about the direction of the trend. One line is red, and the other one is blue.
The red line indicates bears are winning and presents a sell signal. Conversely, the blue line repaints bulls are winning and mentions a buy signal.
The indicator calculates the maximum and minimum values of the bars and then finds out the direction of the trend.
Having this indicator on your side is handy as it can pinpoint where the trend is heading next. In addition, the Filter present in the indicator smooths the process by reducing false signals.
How to trade the Trend Finder indicator?
As mentioned earlier, the Trend Finder indicator paints two lines, red and blue, to mark the direction of the trend.
So, finding buy or sell signals with the Trend Finder indicator is easier than most indicators.
The red line mentions a downtrend, whereas the blue highlights an uptrend.
When the blue line goes above the red line, the trend moves upwards, and you should take buy positions.
Contrarily, when the red line goes above the blue line, the trend moves downwards, and you should go short.
The good thing about the indicator is that it has a filter value. This limits false signals of the price action.
A key point to add here is the indicator gives you a buy or a sell signal, so you need to carefully observe the red and blue lines before entering the trade.
Let’s find out the buy and sell strategy for the indicator:
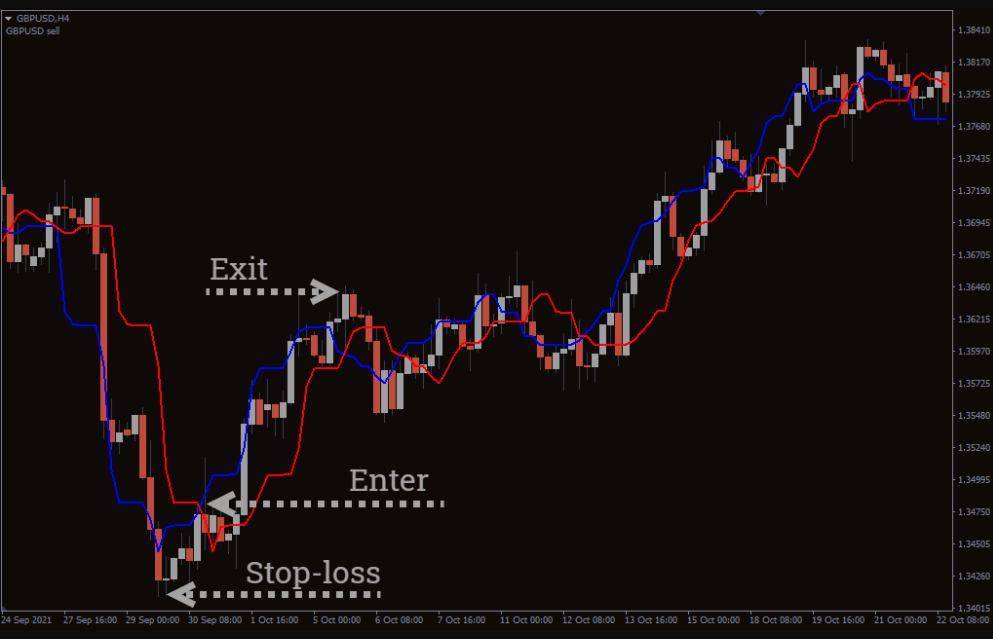
Trend Finder indicator buy strategy
The blue line should be above the red line.
Wait for the price to change its path.
Enter the trade at the crossover.
Place a stop-loss near the low of a buying point.
Exit the trade when the blue line goes below the red line.
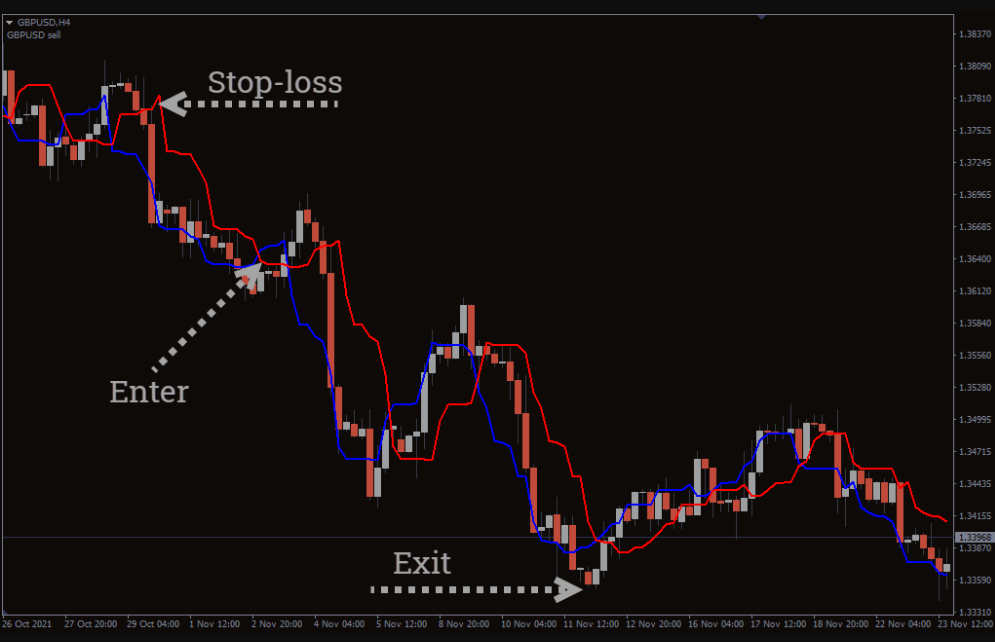
Trend Finder indicator sell strategy
The red line should be above the above line.
Wait for the price to change its path.
Enter the trade at the crossover.
Place a stop-loss near the high of a selling point.
Exit the trade when the red line goes below the blue line.
Conclusion
The Trend Finder indicator is a great indicator if you are a trend trader as it tells you the direction of the underlying trend.
You can apply the Trend Finder indicator on any timeframe as it is a trend-following indicator. You can also combine the indicator with other oscillators like the RSI or Stochastics.
You must be logged in to post a review.

Copyright 2025
Reviews
There are no reviews yet.