Forex BUY and SELL signals from the best TradeTime v2 Indicator Indicator. Find out the direction of the trend.
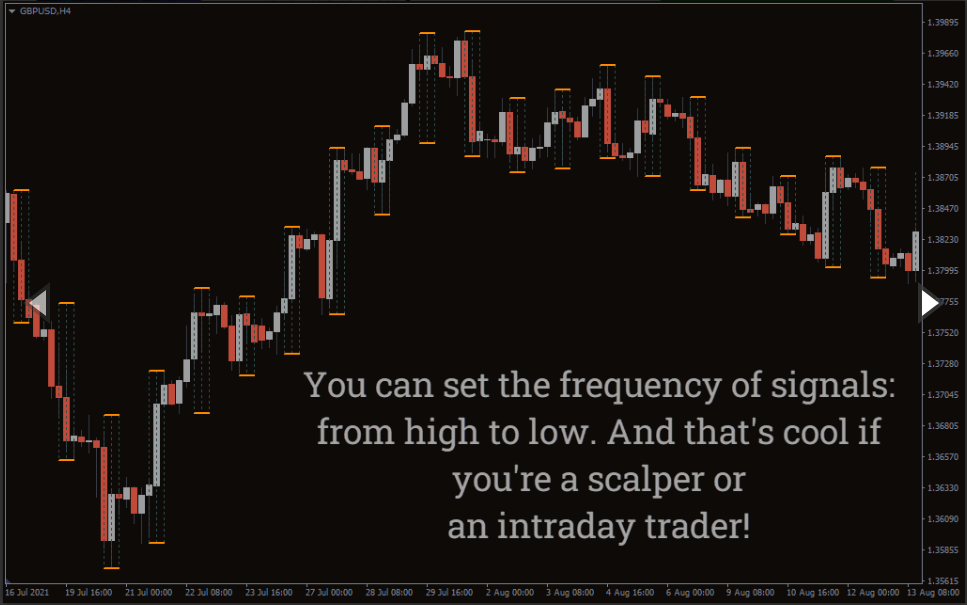
The TradeTime v2 Indicator is a simple MT4 indicator that tells the direction of the trend. The indicator plots a rectangle box on the candlesticks according to the time. Whichever timeframe the trader chooses, the indicator draws a box accordingly.
Whenever there is a strong trend, the Indicator illustrates the box, and when the trend begins to fade, it plots another box to show the end of the trend. The indicator works best on higher timeframes like the H4, daily or weekly charts.
TradeTime v2 Indicator BUY/SELL signals
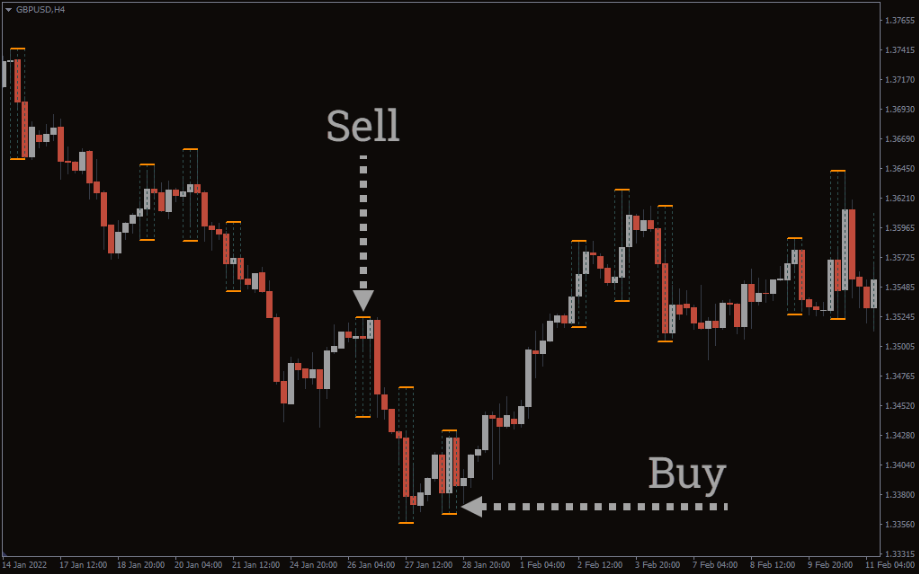
The above GBP/USD H4 chart shows the BUY and SELL signals with the indicator. To determine BUY and SELL signals, traders need to look at how the Indicator plots boxes. Usually, the indicator draws boxes at the start of the trend. In an uptrend, the indicator will plot the box at the bullish candle, and traders can enter long.
Conversely, the TradeTime v2 Indicator draws boxes on the bearish candle at the start of the trend. Here, traders can enter short. You can also use the indicator with other indicators like the RSI or MACD for further signal confirmation.
Conclusion
The TradeTime v2 Indicator is a time-based MT4 indicator that tells the direction of the trend according to the starting and ending ours. Furthermore, you can download the indicator for free on our website.
Reviews
There are no reviews yet.
Be the first to review “TradeTime v2 Indicator” Cancel reply
We use cookies to ensure that we give you the best experience on our website. If you continue to use this site we will assume that you are happy with it.Accept


Reviews
There are no reviews yet.