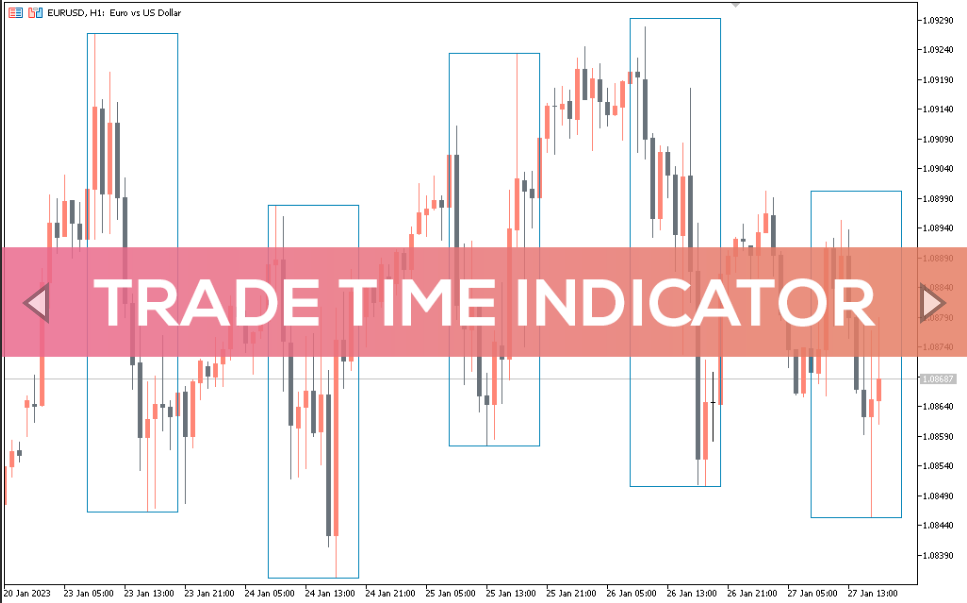
Forex BUY and SELL signals from the best trading time indicator indicator. Find out the direction of the trend.
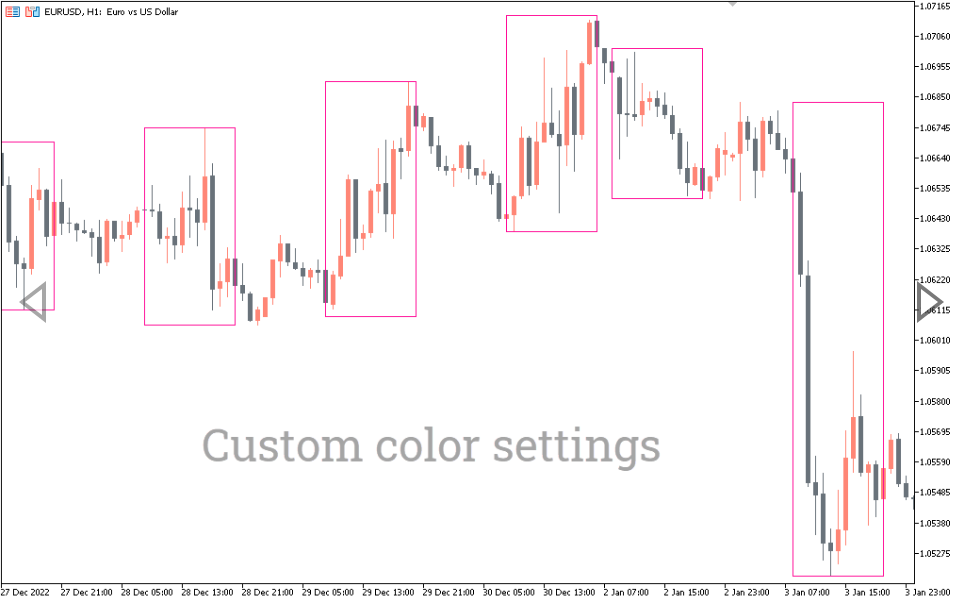
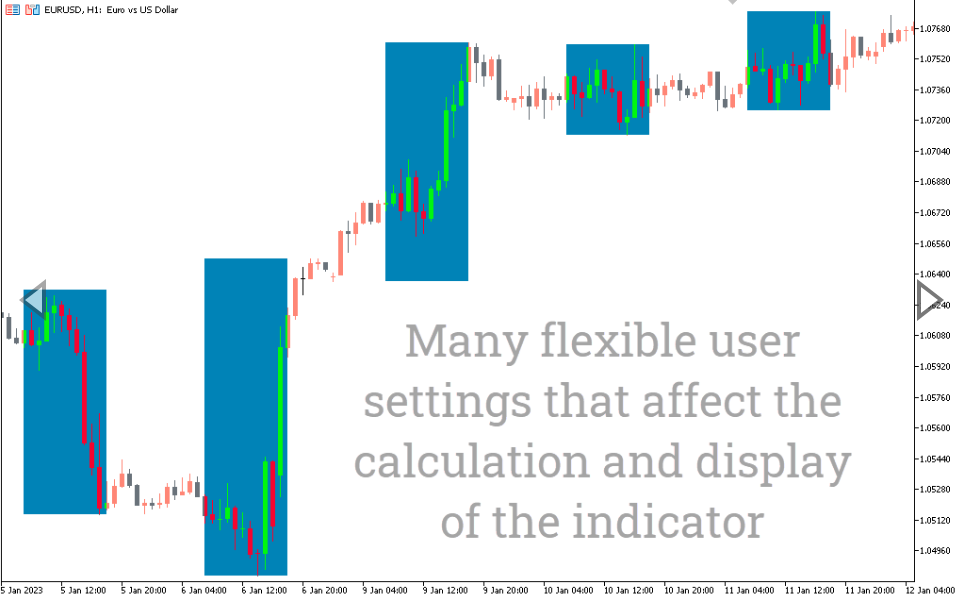
The Trade Time indicator is a simple MT5 indicator that indicates the direction of a trend. The indicator draws a rectangle on the candles depending on the time. Whatever timeframe the trader chooses, the indicator draws the corresponding field.
Whenever there is a strong trend, the indicator draws a rectangle, and when the trend starts to fade, it draws another rectangle showing the end of the trend. The indicator works best on higher timeframes such as H4, daily or weekly charts.
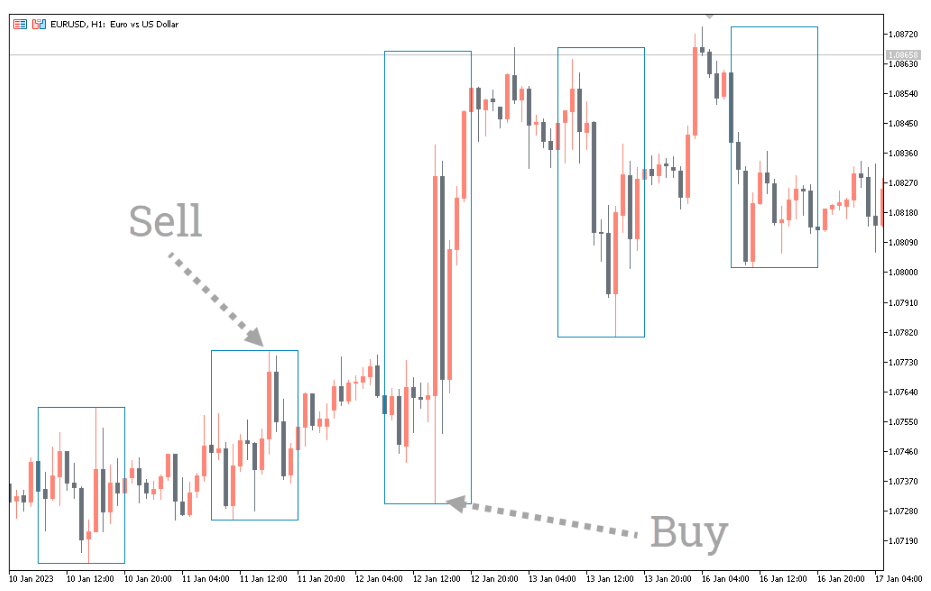
Trade Time Indicator BUY/SELL signals
The GBP/USD H4 chart above shows the BUY and SELL signals of the indicator. To identify BUY and SELL signals, traders need to look at how the indicator displays the fields. Usually the indicator draws rectangles at the beginning of a trend. In an uptrend, the indicator draws a rectangle on a bullish candle, and traders can open long positions.
Conversely, the time to trade indicator draws rectangles on a bearish candle at the start of a trend. Here traders can open short positions. You can also use the indicator with other indicators such as RSI or MACD to further confirm the signal.
Conclusion
The Trade Time indicator is a time-based MT5 indicator that indicates the direction of a trend according to its start and end. In addition, you can download the indicator for free on our website.
Reviews
There are no reviews yet.
Be the first to review “Trade Time Indicator” Cancel reply
We use cookies to ensure that we give you the best experience on our website. If you continue to use this site we will assume that you are happy with it.Accept

Reviews
There are no reviews yet.