Trade Channel Indicator
Trade channel indicator for mt4 – download free. Auto Fibonacci Indicator for mt4. Best trend reversal mt4 indicator. Best support and resistance mt4 indicator.
Categories: Trend, MT4, Channels
The Trade Channel indicator for MetaTrader is the best forex trading tool to identify the potential support/resistance level of an asset. It was designed to help you analyze and anticipate a possible change in the trend bias of the market at significant price levels.
This technical trading indicator is a blend of the RVM Fractal level and the Fibonacci fan indicator. These two combinations (Fractals and Fibonacci retracement) form a powerful tool for projecting a trend reversal zone. Besides, it also helps you to spot optimal trade entry/exit points.
So, essentially, the Trade Channel indicator is like a double-edged tool for identifying and trading trend reversals at pivotal zones like the Fibonacci and fractal levels.
The indicator automatically plots a trading channel. It does this by identifying the fractal levels and Fibonacci retracement points on your MT4 chart. Moreover, it also plots the levels (Fractal and Fibonacci) in sync with the major trend of the market to ensure you don’t trade against the trend.
Furthermore, the Trade Channel indicator can come in handy for scalping, day/intraday, and swing trading. Besides, it is also suited for different categories of traders. For example, as beginners, intermediate and advanced traders.
How to Trade With Trade Channel Indicator
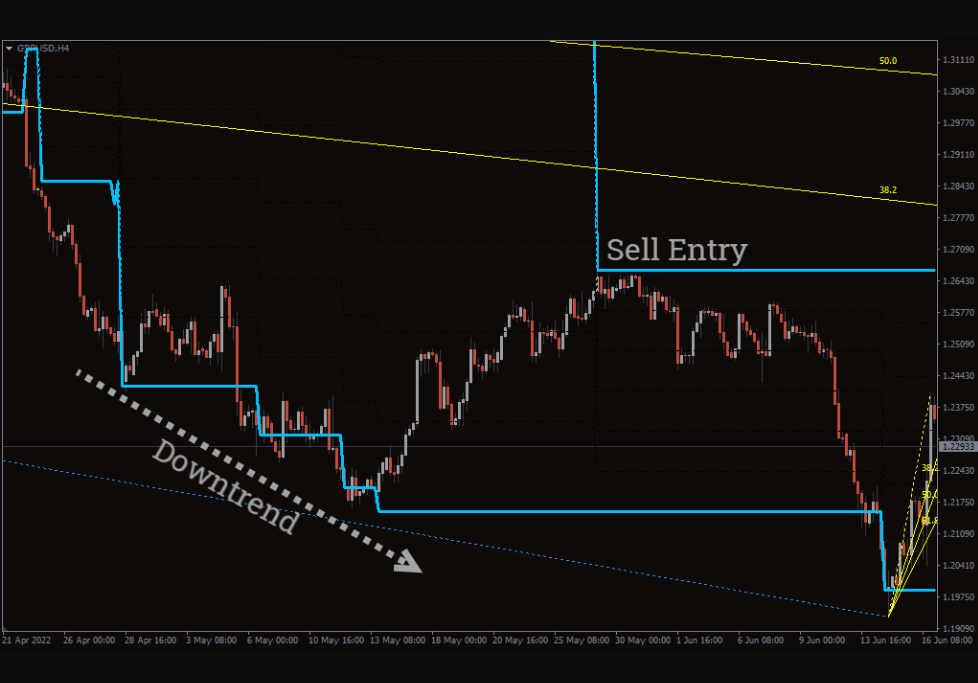
The above screenshot depicts how the Trade Channel indicator would look on your MT4 chart. It also illustrates how to identify a high-probability trade setup.
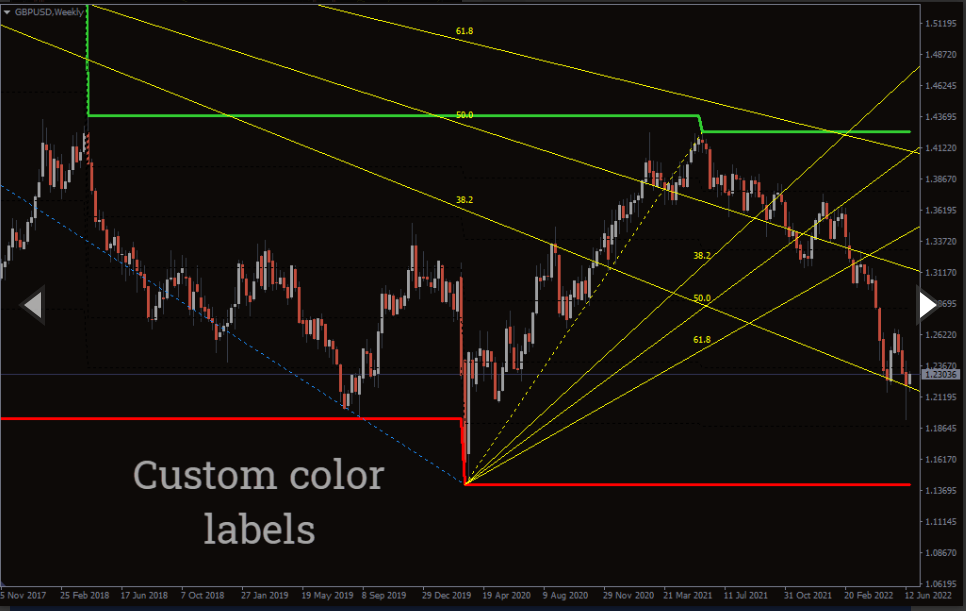
The indicator is recommended to be used along with price action/and or other technical indicators for better efficiency. The deep blue thick line is the Fractal level, while the yellow lines are the Fibonacci retracement points with their corresponding values.
BUY and SELL Signals: Wait for the indicator to paint the Fractal and Fibonacci levels when the trebd is bullish. With this condition, you may then open a BUY/LONG position after the price retraces back and touches any of the levels (Fractal or Fibonacci). The same principle is also applicable to SELL signals.
The above SELL signal (on the screenshot) is a very powerful trade setup that suggests a high probability of a bearish reversal. This is because the price meets at the Fractal level which also coincides with the 50.0% Fibonacci level. In other words, the price showed double confluence for trend reversal.
Conclusion
The Trade Channel indicator for MT4 helps you to easily identify potential support/resistance zones with more precision. However, the indicator is not a Holy Grail; hence, it should be used with price action (e.g. wick rejection, bullish/bearish engulfing, etc.) to achieve a higher winning rate. Finally, you can download this indicator for free.
You must be logged in to post a review.

Copyright 2025


Reviews
There are no reviews yet.