TMA+CG Indicator
TMA+Center of Gravity is a perfect Indicator for MT4 for channel trading. An ideal tool for identifying trend direction and suitable trade entry points.
Channel trading is one of the best trading strategies. TMA+CG Indicator plots a channel to help traders track the price movements and help traders identify support and resistance levels. It provides you with accurate channels and saves you time. TMA+Center of Gravity is a combination of Triangular Moving Average
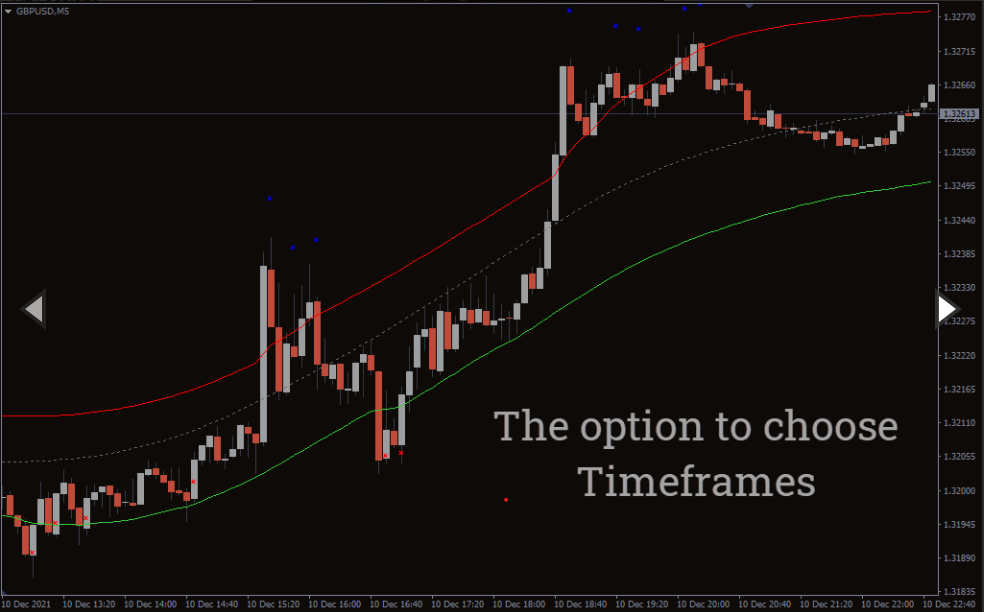
The TMA+Center of Gravity indicator – download free is simple to use, meaning traders of any experience level can use it with ease. It is perfect for swing trading but works well with trading strategy. Additionally, you can use it to trade any forex currency and other financial instruments. The indicator can be used at any time frame for day trading and scalping.
Buy and Sell Signals
I know you are eager to learn how to use the TMA+CG indicator to spot suitable trade entry points. The indicator is designed with smoothed moving averages. This means you get clearer signals for the same value in the conventional TMA indicator.
The channel also works like Bollinger bands. The upper band represents an overbought zone hence ready to bounce, while the lower band represents an oversold.
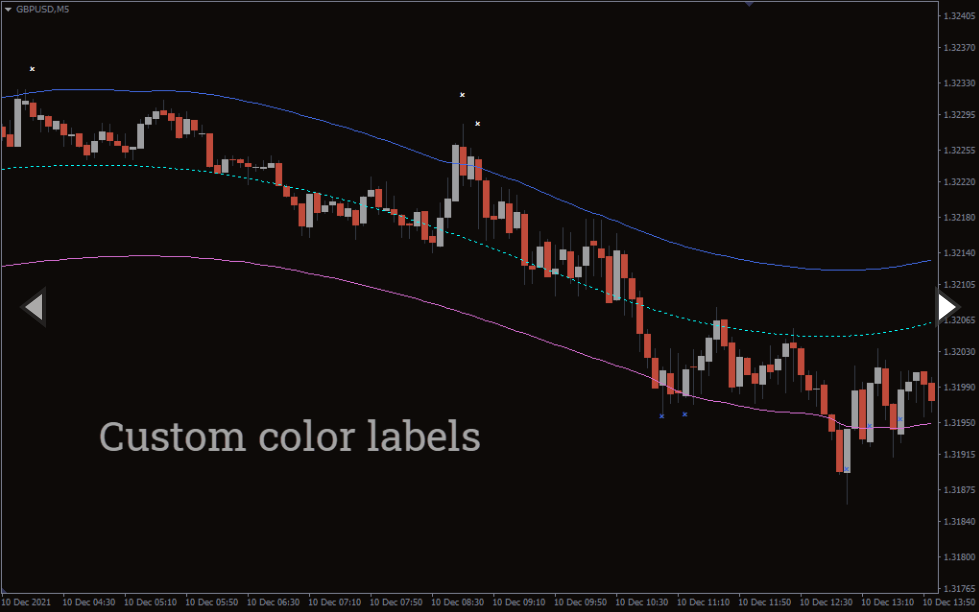
Buy when the price touches the lower band, which acts as a dynamic support. The indicator forms a blue cross when the price moves beyond the channel on the upside. This signifies a sell signal.
Sell when the price touches the upper band, the dynamic resistance. When the channel touches the lower line, the indicator forms a red cross indicator, a good price entry point.
Place the stop loss several pips above the swing high for short positions and below the swing low for long positions. The crosses also act as an ideal stop-loss point.
Chart Example
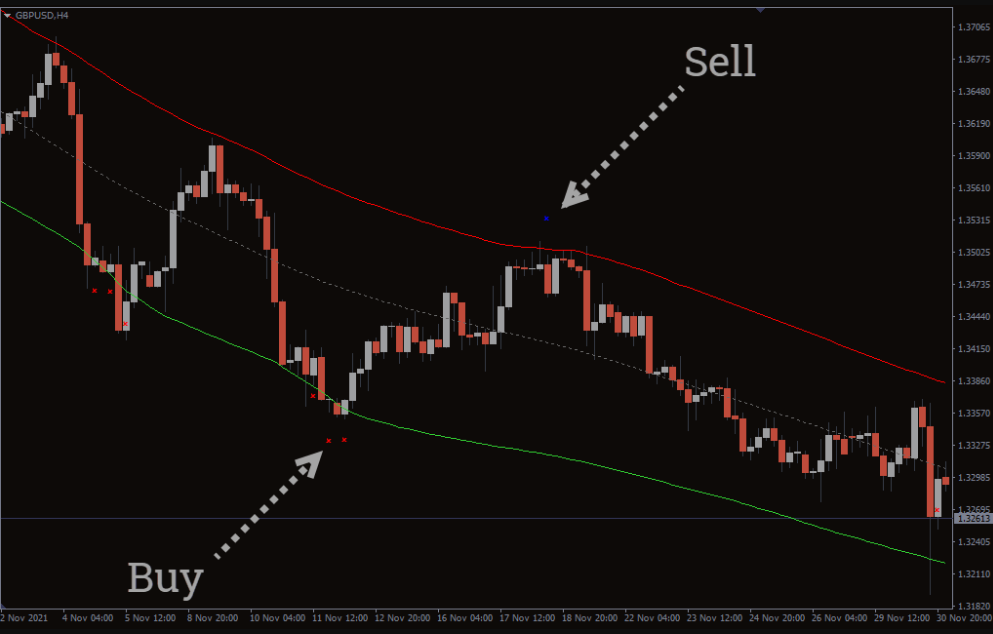
The chart shows price movement for the Great Britain pound against the US dollar. The indicator has drawn two lines, the green, which acts as the lower band, and the red line, which serves as the upper band.
When the price breaks below the indicator channel, the indicator forms red crosses indicating a great dynamic support level, as shown by the blue arrow. This is an ideal level or opening buy position. In fact, the trade moved more than 60 pips after the signal. The indicator also posts a red arrow shown by the white arrow when the price touches the upper band, which acts as a dynamic resistance level. The price moved over 100 pips after the signal.
Conclusion
TMA+CG Indicator is one of the MT4 indicators you can use to draw trade channels. The upper line acts as a resistance level and the lower line as support. When the price touches the lines, the indicator draws a cross that indicates impending trend change. Therefore, you should enter the trend when the indicator posts red or blue crosses. You might want to use the indicator in combination with other tools to enhance the signals.
You must be logged in to post a review.

Copyright 2025

Reviews
There are no reviews yet.