Tick On Chart Histogram Indicator
This Forex indicator shows tick fluctuations inside M1 candles. Indicator for active trading. The best entry point search. Free download, easy to install. Tick histogram.
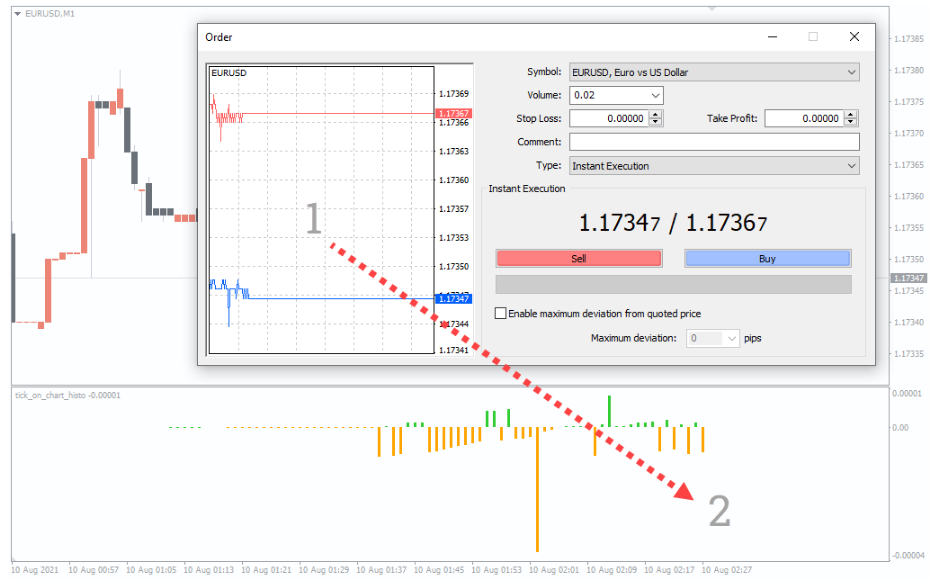
This indicator is the best tool for active intraday traders, scalpers and those looking for the accurate entry points. Tick data is the smallest fluctuations in price. They are only visible in the classic Order window (1) in the Metatrader 4. The window cannot be expanded, it is displayed over the main chart, and the tick data quickly goes into history. This can be a problem, which is solved by using The Tick On Chart Histogram indicator.
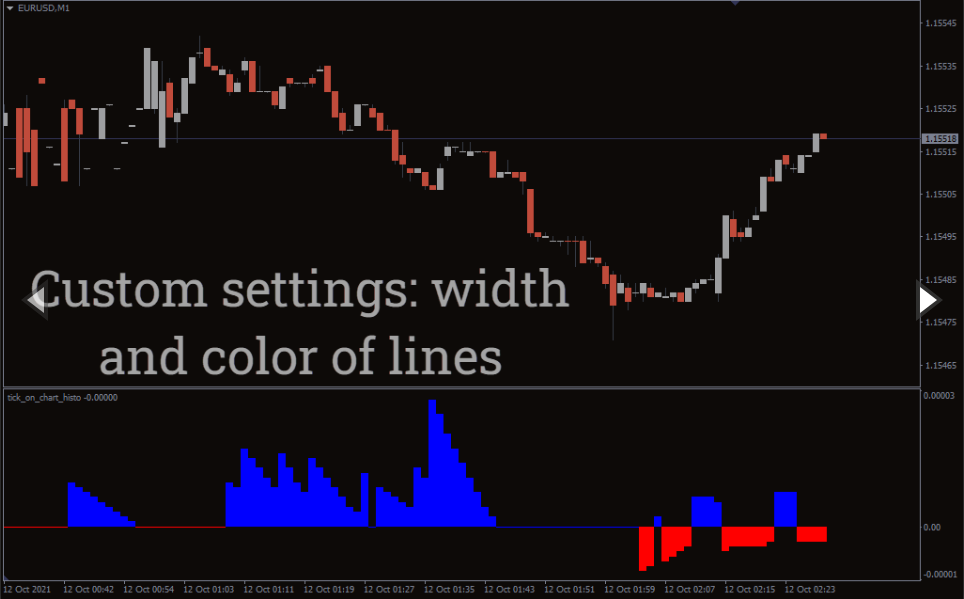
Thanks to this indicator for the MT4, you can see the tick fluctuations directly on the chart in its lower part (2).
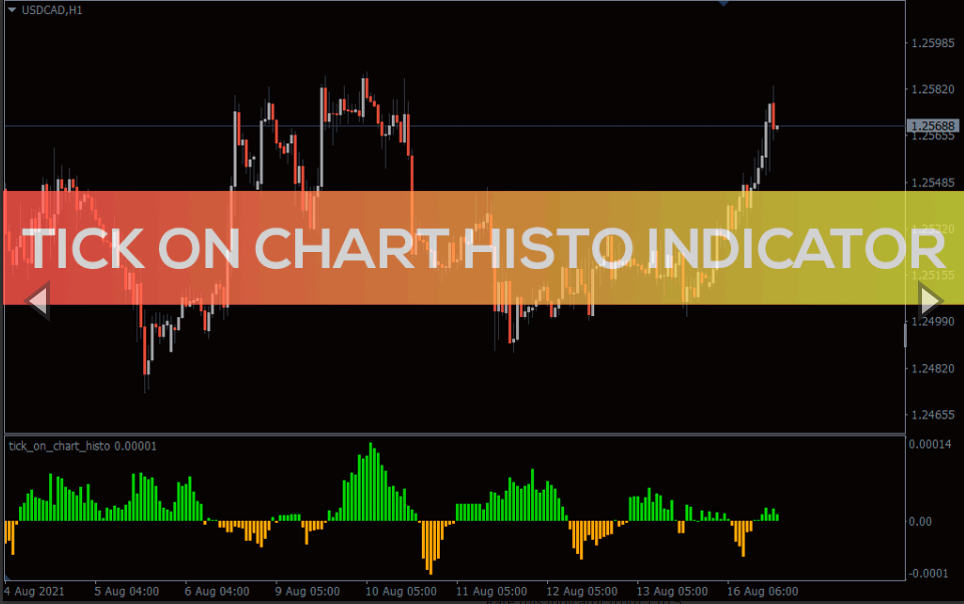
The indicator automatically presents the tick data in a tiny histogram, which can be scaled and adjusted.
The Tick On Chart Histogram for MT4 helps you track the fading and occurrence of market impulses, and allows you to collect more tick data for analysis.
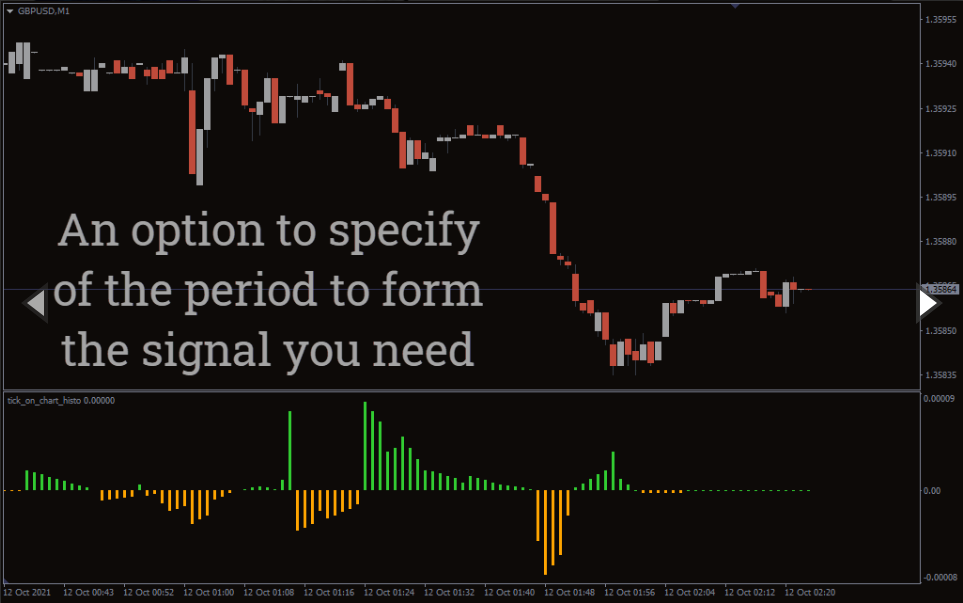
Tracking tick fluctuations can be useful for finding the best entry ponits. The indicator can be especially convenient for intraday traders.
Regardless of what strategy you use, consider using this indicator. It is updated in real time, works with any markets / brokers and has super simple settings.
Important Notes
Bars on the histogram do not correspond to bars / candlesticks on the price chart.
The Tick On Chart Histogram does not give specific signals to buy and sell. It doesn’t show resistance / support zones. And used as an assistant in implementing trading decisions.
Each time you restart the terminal, the indicator will need some time to collect data as long as tick data is not stored anywhere in mt4.
Another peculiarity of the indicator may be that it tends to redraw. However, this does not mean that the indicator changes its readings. Simply, the bars of the histogram can shift up/down to fit better in the window.
Conclusion
The Tick On Chart Histogram removes the limitations of the MetaTrader terminal and can become an indispensable tool for active intraday forex trading.
The indicator shows the tick fluctuations as a histogram at the bottom of the chart. The Tick On Chart Histogram can help you to:
find the most accurate entry points into a position;
trace the occurrence / decay of impulses;
analyze tick data for a long period of time.
Download this MT4 indicator for free NOW!
You must be logged in to post a review.

Copyright 2025
Reviews
There are no reviews yet.