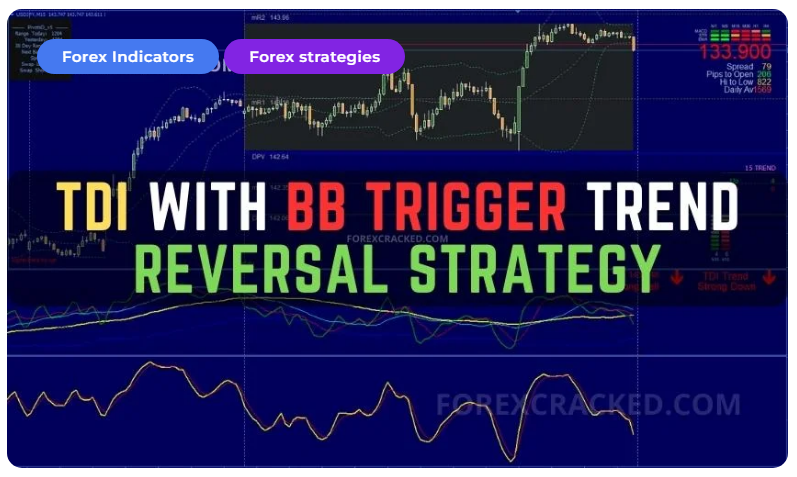
TDI with BB Trigger Trend Reversal Strategy
Indicators Used in this Trend Reversal Strategy
To grasp the complete picture of this strategy, let’s dive deep into each component and indicator.
Bollinger Bands
Bollinger Bands are a statistical chart characterizing a financial instrument or commodity’s prices and volatility over time. They consist of a simple moving average (middle band) and two standard deviation lines (upper and lower bands). When prices are highly volatile, the bands widen and move further away from the average, and during less volatile periods, the bands contract.
In this Trend Reversal Strategy context, the price’s interaction with the Bollinger Bands is vital. The strategy dictates that traders should wait for the price to bounce off or break the lower Bollinger Band before considering entry into the market.
Trader Dynamic Index (TDI)
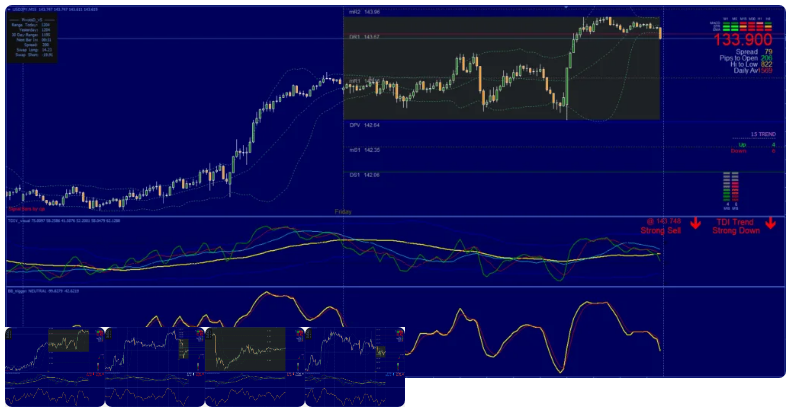
The TDI is an indicator that gathers information on price direction, volatility, and market sentiment. The TDI displays a Green line (fast-moving average), a Red line (slow-moving average), and a Blue line (market baseline). The crossover of the green and blue lines can often indicate potential market reversals.
With this strategy, traders should wait until the green line on the TDI indicator crosses upward over the blue line, signaling a potential increase in the price trend.
BB Trigger
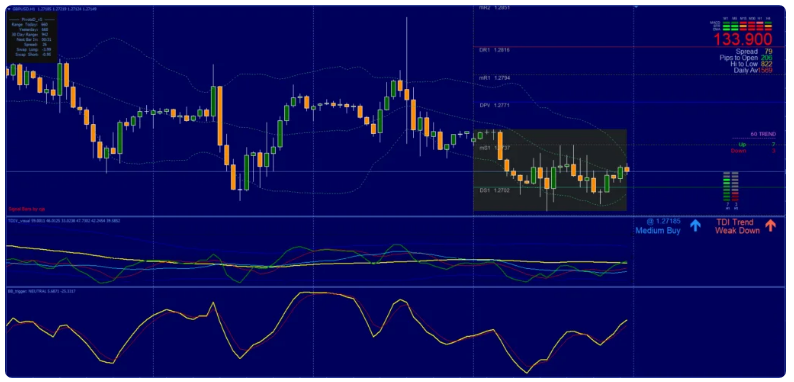
The BB Trigger is another crucial aspect of this Trend Reversal Strategy. This momentum indicator can show when a particular asset is overbought or oversold within the trader’s chosen time frame. This, in turn, gives signals for potential trend reversals.
The BB Trigger is an additional tool used to confirm trading signals. It’s essentially an oscillator that helps identify whether market conditions are overbought or oversold, and as such, it serves to pinpoint optimal entry and exit points.
Pivot Points Levels
Pivot points are technical analysis indicators that provide a set of potential support and resistance levels. They are usually calculated from the previous trading session’s high, low, and closing prices. In this strategy, pivot point levels can be used as targets for taking profits.
Trading rules for TDI with BB Trigger System
Remember to tighten your Stop Losses around High Impact News Releases or avoid trading at least 15 minutes before and after these events when using this TDI with BB Trigger System.
As always, to achieve good results, remember about proper money management. To be a profitable trader, you must master discipline, emotions, and psychology. It is crucial to know when and when not to trade. Avoid trading during unfavorable times and market conditions like low volume/volatility, beyond major sessions, exotic currency pairs, wider spread, etc.
Buy Position: Wait for the price to bounce or break the lower Bollinger Band. After this, look at the TDI indicator. You would want the Green line (representing the current market price) to cross upward over the Blue line (representing the market baseline). Meanwhile, the BB Trigger should indicate a long position. This confluence of conditions provides the go signal for a Buy position.
Sell Position: Wait for the price to bounce or break the upper Bollinger Band. After this, look at the TDI indicator. You would want the Green line (representing the current market price) to cross downward over the Blue line (representing the market baseline). Meanwhile, the BB Trigger should indicate a short position. This confluence of conditions provides the go signal for a Sell position.
Initial Stop Loss: Once you’ve entered a long position, it’s essential to manage risk. Place the initial stop loss on the previous low swing or 10-15 pips (the strategy you choose depends on your risk tolerance and the volatility of the market you’re trading).
Take Profit Options: With the position open, the next step is to establish a strategy for taking a profit. You have three options for this:
Middle Band: You can exit your position when the price reaches the middle Bollinger Band. This option is conservative, limiting potential losses and possibly limiting gains.
Opposite Band: A more aggressive strategy would be to wait until the price reaches the upper Bollinger Band. This could maximize your profits, but it also carries the risk of the price reversing before it hits the upper band.
Pivot Points Levels: A balanced approach could be to take profit at the pivot point levels, providing a good compromise between risk and reward.
You must be logged in to post a review.

Copyright 2025
Reviews
There are no reviews yet.