TDI With Alerts Indicator
Enhance your trading strategy with the TDI Alerts Indicator for MT4. Learn how to use it effectively to spot trends and receive clear entry signals on your charts. Customize settings for your trading needs.
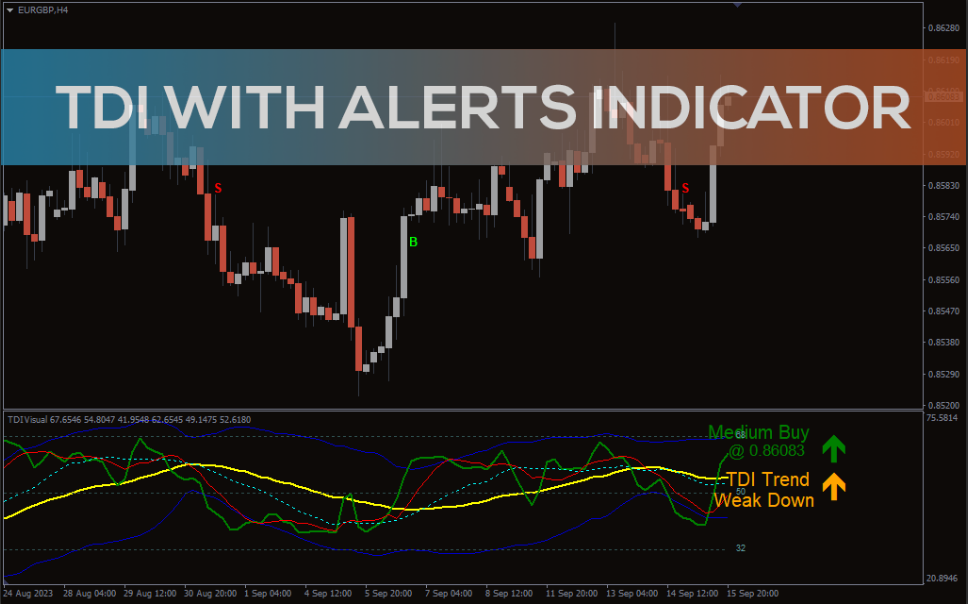
The TDI is based on the fundamental RSI indicator, which indicates how strongly the present trend is holding or how much the price has changed. The indicator uses Bollinger bands to gauge the intensity of the fluctuations. The indicator employs the moving average to smooth the lines. Due to an integrated approach, you can utilize the TDI with Alerts indicator as a complete trading system.
This trading tool lets you choose the ideal time to enter a trade by simultaneously displaying the direction and pace of the current trend. The operation of the indicator is straightforward despite its complexity.
The green line, similar to the RSI in color, depicts the market mood. It illustrates how the market responds to both optimistic and pessimistic expectations.
The red line crosses the green line at its intersection and can be used to enter and depart the market.
The yellow line depicts the general state of the market. It shows the broad trend of the market.
Last but not least, two blue lines—one above and one below—depict market turbulence like the Bollinger Bands.
How To Use The TDI With Alerts Indicator Indicator?
To determine the current trend, use the indicator. When a green line appears above a red line, the short-term trend changes from downward to upward. The short-term trend turns down when green crosses below red.
The yellow line on the TDI with alerts indicator is the most important. The line links all of the other parts and allows for indicator trading. The yellow line can be used to determine long-term trends. When the line deviates from these limitations, it suggests the potential for a shift in trend.
The indicator also shows how strong the market is right now.
Generally, the stronger the market participants, the steeper the slope of the green line. On the other hand, if the line moves horizontally instead of vertically, the market is overly idle.
The Bollinger Bands’ enlargement denotes a rise in volatility. A narrowing of the lines, on the other hand, denotes a reduction in volatility. You should anticipate the release of any major reports or other news that could substantially impact the market when the lines are significantly narrowing. It is best to avoid trading in such circumstances for the time being.
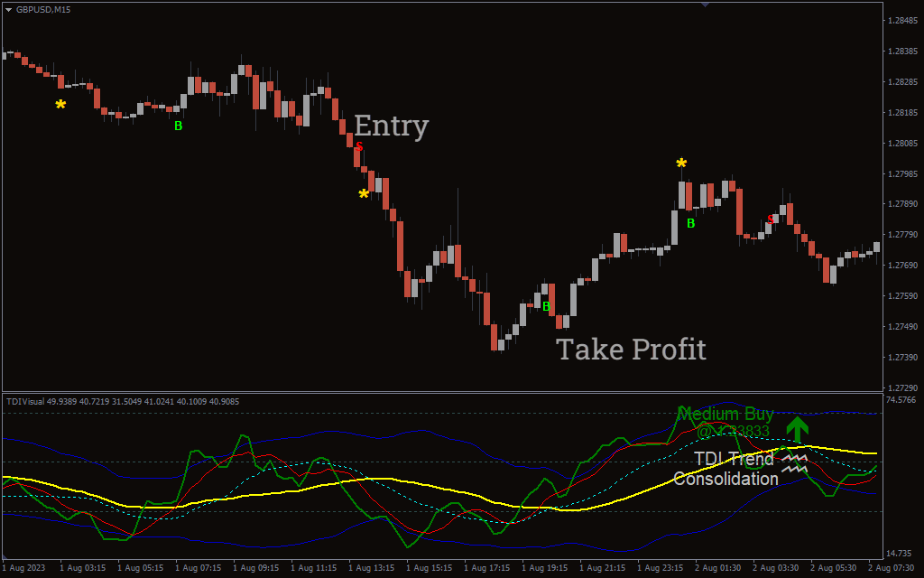
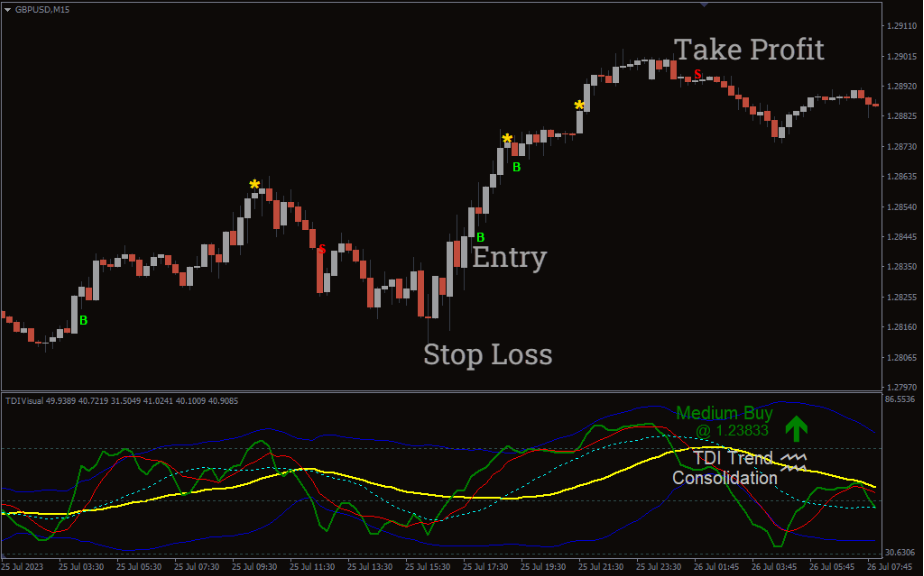
The trade signals are fairly straightforward for this indicator. Ensure the green line is above the yellow and red lines for the buy signal. The indicator will draw a green ‘B’ on the chart. Place a stop loss on the previous low. You should exit when the green line goes below the red line.
For the sell signal, ensure the red line is above the yellow and green lines. The indicator will draw a red ‘S’ on the chart. Place a stop loss on the previous high. You should exit when the red line goes below the green line.
Conclusion
The TDI with Alerts indicator for MT4 combines Moving Averages and Bollinger bands that show you the type of trend and how strong the market is. The indicator also gives out clear entry signals that appear on the chart.
You must be logged in to post a review.

Copyright 2025
Reviews
There are no reviews yet.