Take advantage of overbought and oversold market conditions for good trading opportunities with Swami Aroon Oscillator indicator. Trade with clear color-coded bars that reveal the prevailing market trend.
Like any other oscillator in trading, the Swami Aroon oscillator indicator for MT4 shows overbought and oversold conditions. The indicator oscillates between 0 and 100. When it shows values above 80, the market is overbought. Meanwhile, when it shows values below 20, the market is oversold.
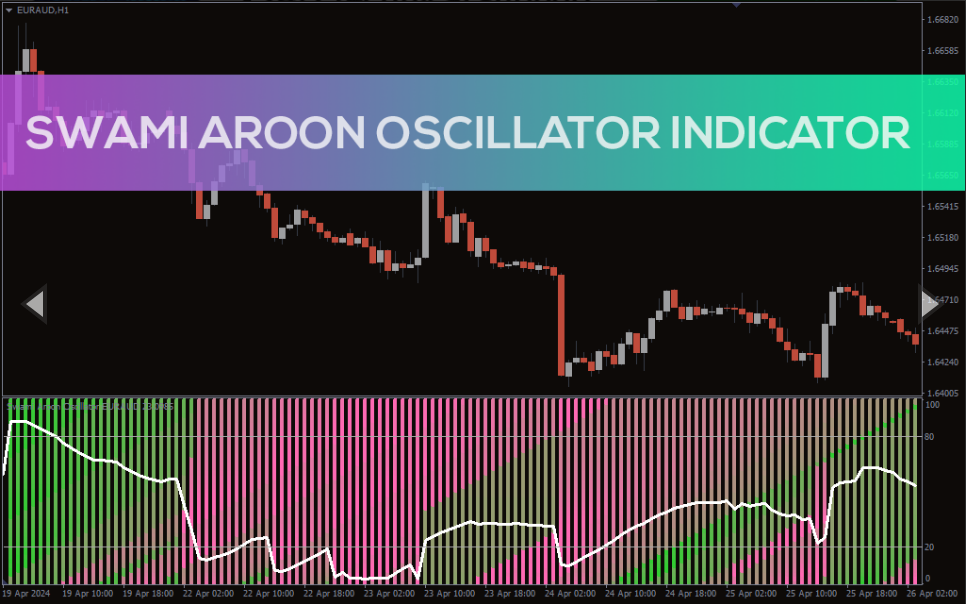
Moreover, the indicator has bars focusing on a recent part of the chart. The bars are lime green for a bullish market and hot pink for a bearish market. Therefore, the color gradually changes to lime green when the oscillator is moving up. On the other hand, when it starts falling, the color changes to hot pink.
How to Use The Swami Aroon Oscillator Indicator for MT4
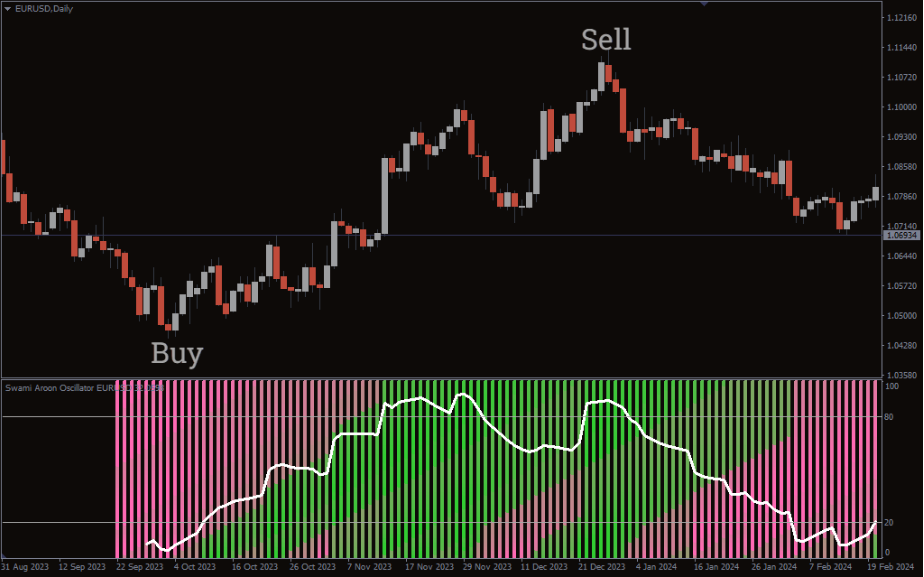
The Swami Aroon indicator for MT4 clearly shows you the best times to buy and the best times to sell. For a buy position, look for the hot pink color of bars that show a downtrend. When the oscillator reaches the oversold region below 20, buy and exit when the indicator gets overbought.
For a sell position, look for the lime green bars, which indicate a bullish market. Wait for the indicator to get overbought above 80 to enter. Hold the position until the indicator gets oversold.
Conclusion
The Swami Aroon Oscillator indicator allows traders to identify overbought and oversold market conditions. Moreover, you can quickly identify the current trend from its color-coded bars, making analysis faster and easier.
Reviews
There are no reviews yet.
Be the first to review “Swami Aroon Oscillator Indicator” Cancel reply
We use cookies to ensure that we give you the best experience on our website. If you continue to use this site we will assume that you are happy with it.Accept


Reviews
There are no reviews yet.