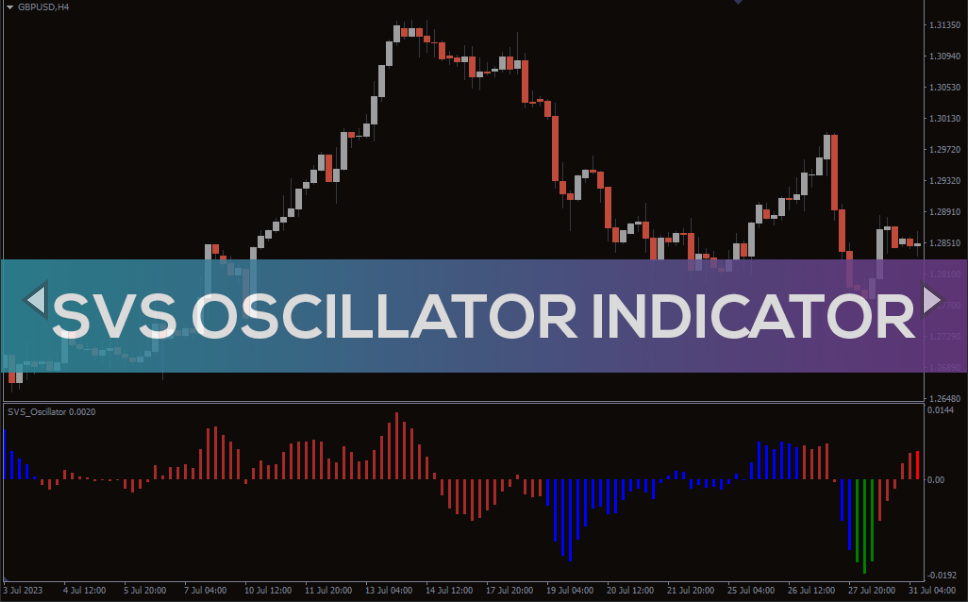
Enhance MT4 Trading with SVS Oscillator: Identify Trends, Overbought/Oversold Markets & Reversals. Adjust Settings for Precision.
The SVS Oscillator is a technical tool that assesses the current market price by comparing it with the prior two extreme values, enabling the evaluation of the strength of a trend. Igor Somov created it and published it in the MQL5 forum in 2014. You calculate the indicator using the following formula:
SVS Oscillator = (Previous Higher High – Current Price) – (Previous Lower Low – Current Price).
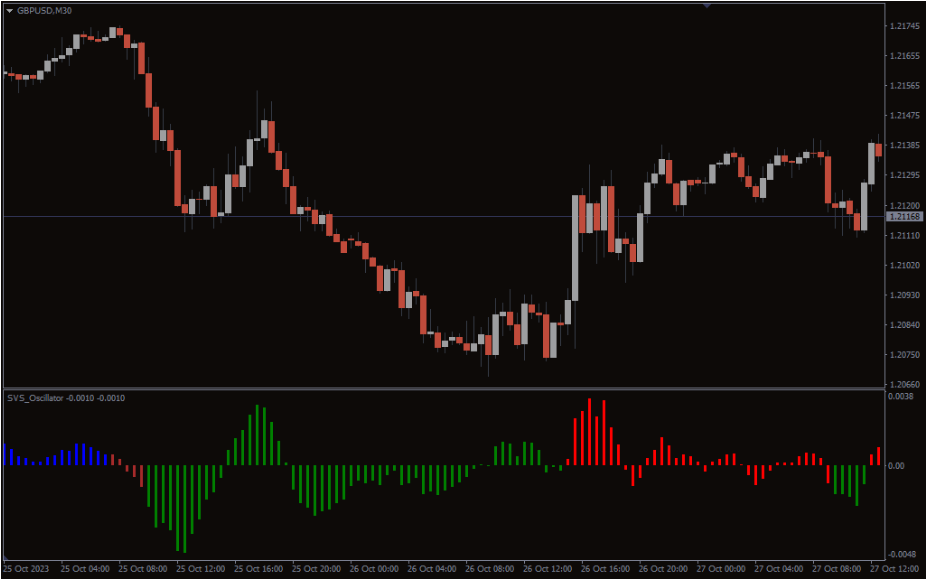
The indicator appears as a histogram on the charts. When the histogram is positive, it indicates that the price is currently closer to the previous high than the previous low. This indicates a strong trend.
When the histogram is negative, the price is closer to the previous low than the previous high. This indicates a weak trend.
How To Use The SVS Oscillator Indicator For MT4
You can use this indicator in various ways. The indicator can show you when the market is overbought or oversold. When the indicator rises over a specific level on the positive side of the vertical scale, it shows the market is overbought. For the oversold market, the histogram moves below the zero line to particular levels on the negative side of the vertical scale.
You can use it to identify trend reversals.
Wait for the indicator to cross above zero from below. When it moves above the zero line, it indicates the beginning of a new uptrend. Wait for the indicator to cross below zero from above. When it moves below the zero line, it indicates the beginning of a new downtrend.
Conclusion
The SVS Oscillator Indicator appears as a histogram on the chart. You can use it to spot trend reversals and overbought and oversold market conditions.
Reviews
There are no reviews yet.
Be the first to review “SVS Oscillator Indicator” Cancel reply
We use cookies to ensure that we give you the best experience on our website. If you continue to use this site we will assume that you are happy with it.Accept


Reviews
There are no reviews yet.