Support&Resistance Indicator
Automatic construction of the most relevant support and resistance zones in the forex market using the Support & Resistance indicator.
It is curious that by default there is no indicator in the MT5 terminal that would automatically build support and resistance levels. After all, these levels are one of the key elements of technical analysis, which is used by many traders. Automatic support & resistance indicator solves this problem.
Indicator description
The support and resistance indicator automatically displays important SR levels on the chart.
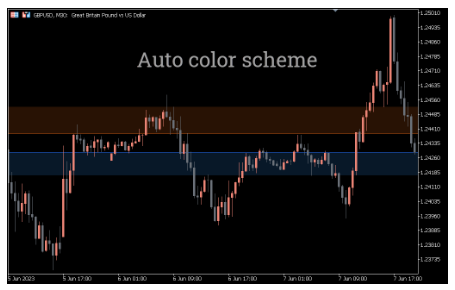
Resistance levels (zones) are shown on the chart in red, while support levels (zones) are shown in blue. Support levels indicate the possible interest of buyers when the price approaches them.
Resistance levels indicate the opposite – when the price approaches these levels, sellers may be interested.
Auto-drawing by the indicator of the actual levels of support and resistance allows you to save time and effort when analyzing the chart. This will certainly be a big plus for both professionals and novice traders.
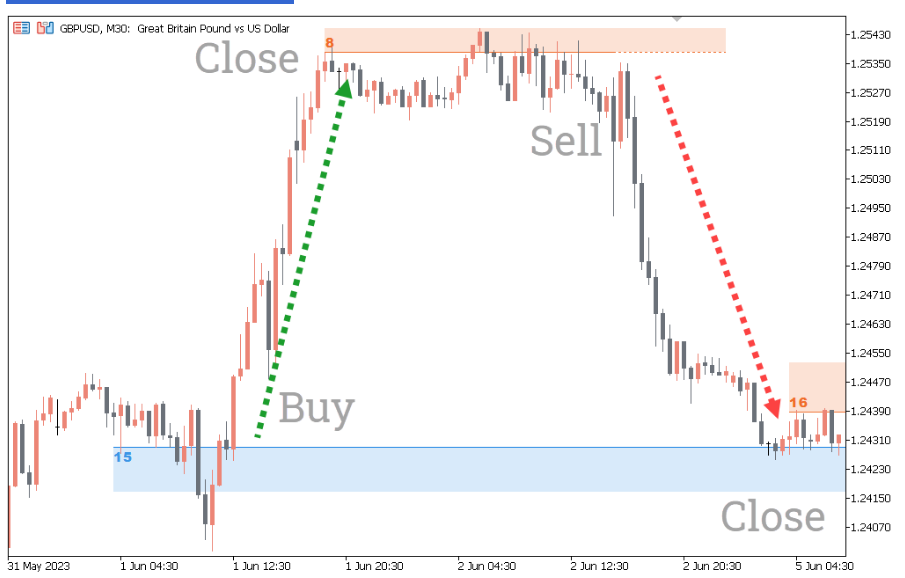
The levels of SR displayed by the indicator can serve as a guideline for placing orders when closing positions (stop loss and take profit). They also help to determine the signals for opening trades.
Indicator drawing technique
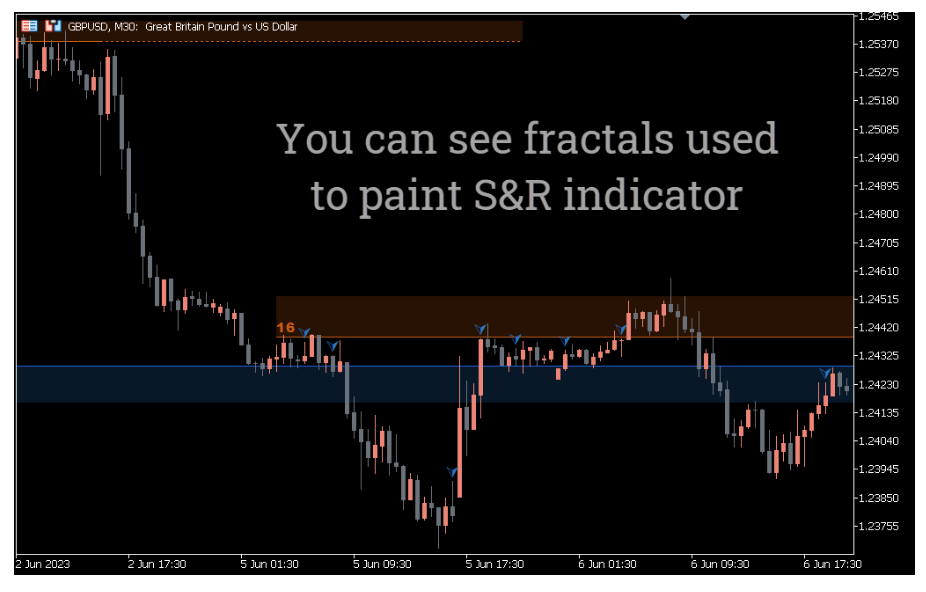
Support and resistance levels, as a rule, are built using market extremes – the so-called fractals. The standard set of indicators in the MT5 terminal contains the Fractals indicator. It displays these extremes.
The SR indicator already includes a fractal indicator. It builds SR levels based on the points where there were the most fractals.
The resistance level in this case is built on 11 fractals. You can check which fractals it is based on by clicking on the number located at the beginning of the resistance level.
The height of support and resistance levels depends on how far apart the fractals are.
The greater the distance between the upper and lower fractals of the support/resistance level, the higher the height of the constructed level will be.
The opposite is also true: the closer the upper and lower level fractals are to each other, the lower its height will be.
Thus, the indicator does not redraw, but changes the height of the levels when new fractals appear.
How to trade using the indicator
Trading methods based on SR zones are often presented as breakout or bounce signals. However, the specifics of trading these methods are different for flat and trend.
Trading from the bottom of the flat to the top and back is usually one of the simplest and most profitable trading strategies.
But it is important to understand that flat is a temporary phenomenon in the forex market. Sooner or later, the flat will be replaced by a trend.
The combination of support and resistance zones in this case forms a small flat.
According to technical analysis, the probability of a flat breakout is higher in the direction in which the trend was oriented before the flat. Therefore, we assume that the probability of a breakdown of the resistance zone is a more realistic scenario than a downward movement.
This allows you to consider buy deals from the support zone during the trading day. It also allows you to consider transactions for a breakdown of the flat up in the medium/long term.
At the stage of an active trend, SR zones act as levels. From these levels, you can make a profitable trade in the direction of the main trend.
The combined use of trend lines and support/resistance zones in a trading system initially increases the chances of a successful trade.
Thus, the support and resistance indicator can become an indispensable tool in chart analysis. The combination of various settings and high efficiency make it possible to productively use the SR Zones indicator in the trading system of almost any trader.
You must be logged in to post a review.

Copyright 2025

Reviews
There are no reviews yet.