Support and Resistance Indicator
Trend reversal indicator. Auto support resistance indicator. Free forex indicator.
Support and resistance are the basic and widely used trading strategies in the financial trading world. The Support and Resistance indicator for MetaTrader is the best technical tool for identifying potential areas of a support or resistance zone.
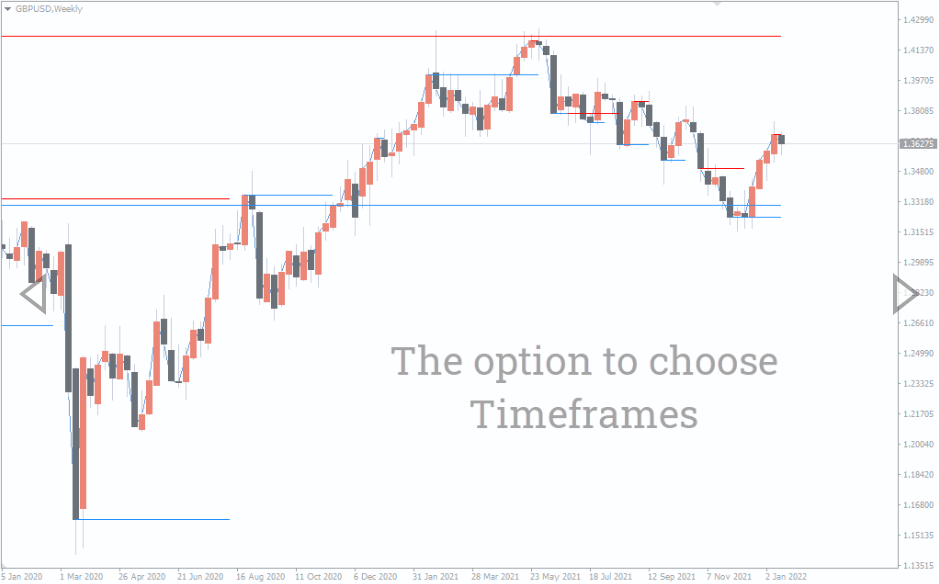
The indicator is a multi-timeframe indicator that automatically scans through different timeframes for support&resistance zones. It displays lines of the support&resistance zones of a specified period in all the time frames. This implies that the indicator would show the support&resistance lines of H4, D1, W1, and MN on an H4 timeframe, for instance.
This technical indicator automatically identifies and draws the zones on your MT4 chart, making it a less hassle for trading support&resistance zones.
This indicator can be used for different trading strategies like scalping, day/intraday, and swing trading. Besides, the indicator would be a great asset for novice traders still trying to grasp how to identify such zones. The indicator would also help the advanced traders to save more time.
How Do You Identify Forex Support and Resistance?
Major support&resistance are identified around the highs and lows created by the market. This infers that the lower lows are potential support zones while higher highs are potential resistance zones. Furthermore, physiological levels (rounded numbers, e.g. 1.4200, etc.) of the price are also potential support&resistance zones.
How Do You Draw Support&Resistance Lines?
Support&resistance lines are drawn with either a trend line or a horizontal line. The idea is to draw a line that connects at least two peaks or troughs.
How To Trade With The Support and Resistance Indicator
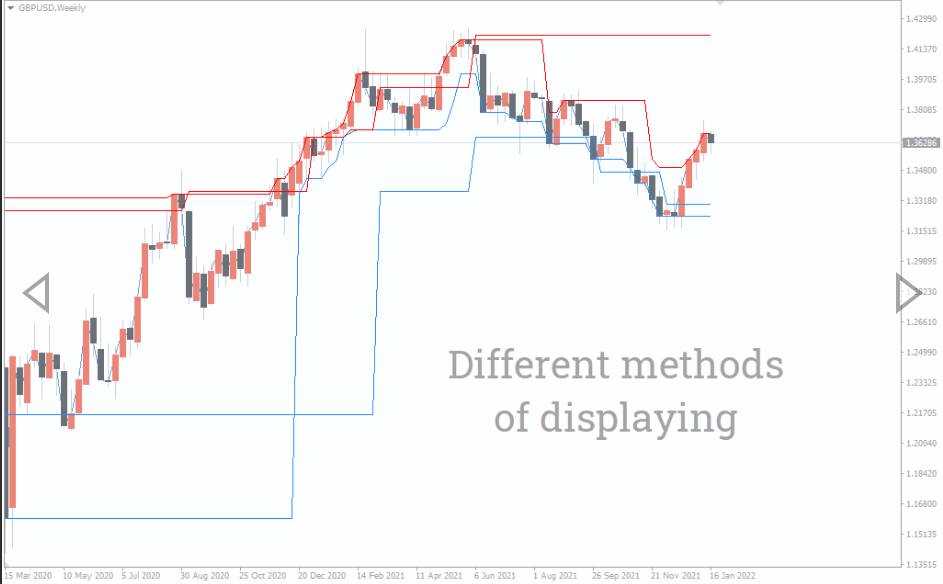
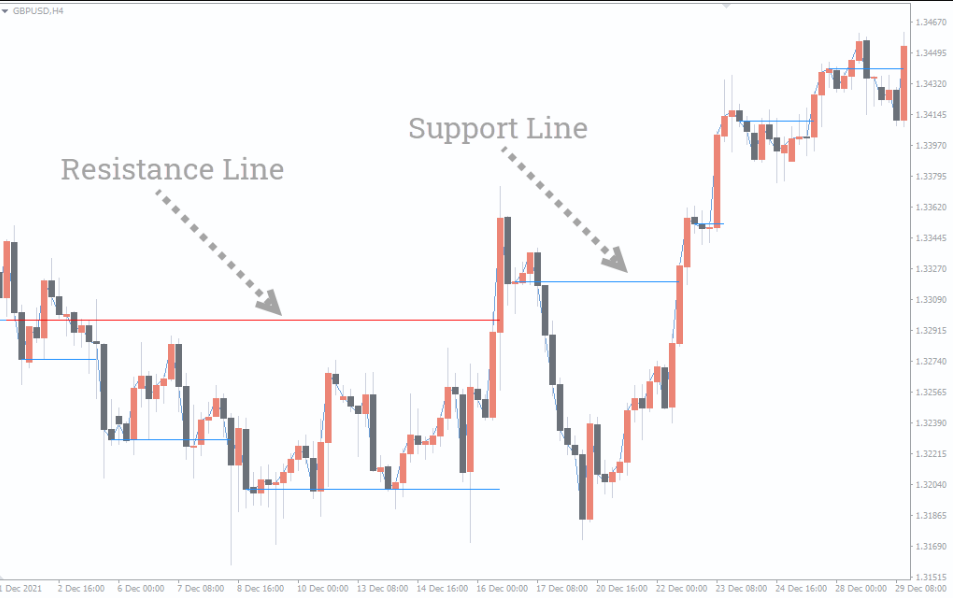
The above screenshot shows how thes indicator would look on your MT4 chart. The multiple lines are the support&resistance zones from the multiple timeframes. The RED lines are the resistance zones, while the DODGER BLUE lines are the support zones.
The indicator can be used to trade trend reversal and trend continuation. Note that a broken support zone becomes a potential resistance zone and vice versa. This means that you can look for a trend reversal pattern for a BUY/SELL entry as the price bounces off the indicator. In the same vein, you may as well look for a price continuation pattern (e.g. lightning bolt pattern) and open a BUY or SELL trade in the direction of a broken support&resistance.
Conclusion
The Support and Resistance Indicator for MT4 makes technical analysis more convenient. It helps you to quickly spot potential support&resistance zones with a single glance on your chart. Finally, the indicator is free to download.
You must be logged in to post a review.

Copyright 2025

Reviews
There are no reviews yet.