The Step Chart RSI Indicator for MT5 helps traders eliminate false forex reversal signals of the classic RSI indicator using a step and moving average filter
The Step Chart RSI Indicator for MT5 is a classic RSI indicator with a step filter and a moving average. Most forex traders receive false trading signals while trading with RSI alone. However, the filters of this indicator help Forex traders receive quality trading signals and eliminate most false starts.
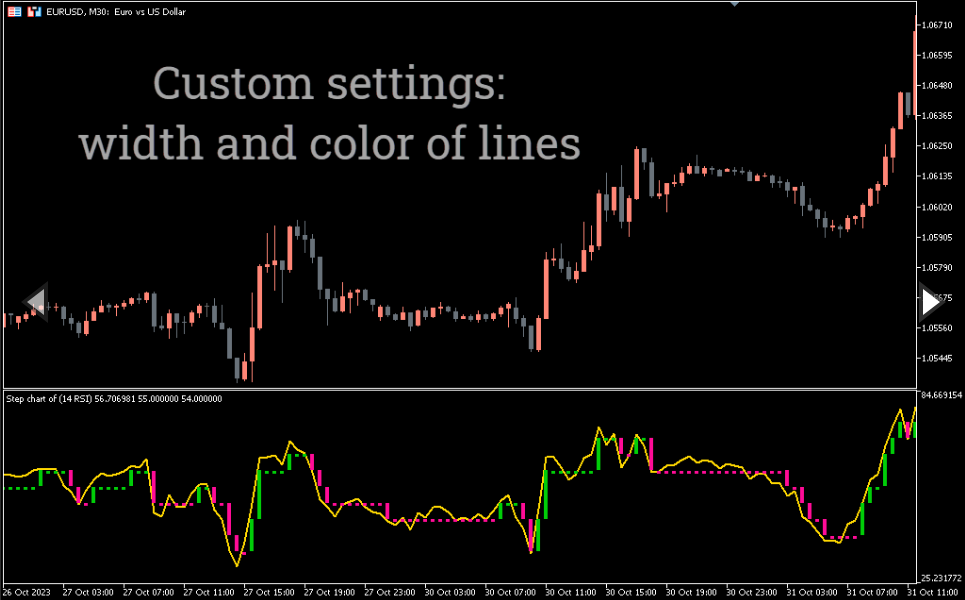
The indicator is easy to interpret as it only contains an RSI line and a moving average line.
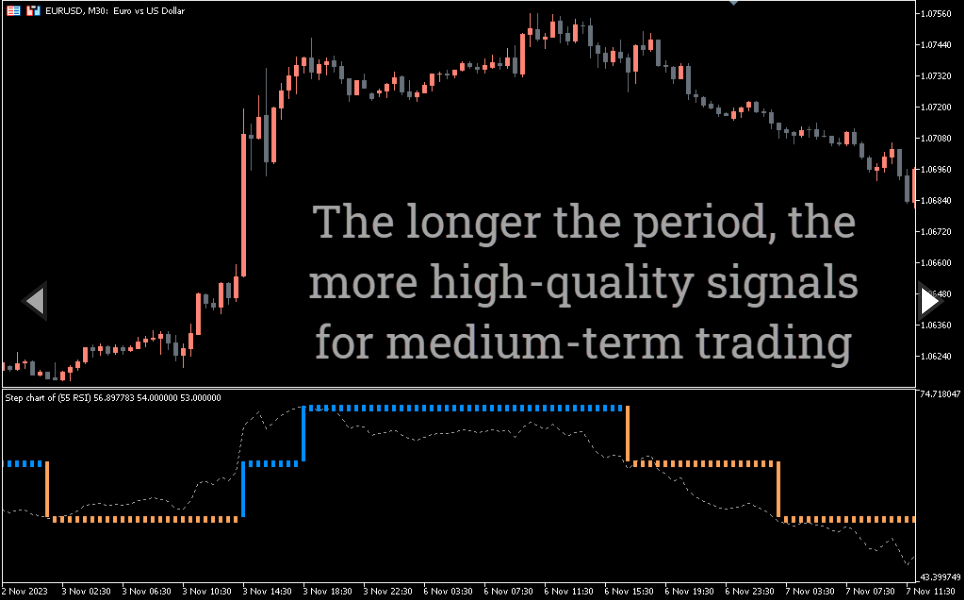
Thus, it is suitable for new and experienced Forex traders. Additionally, traders can display this indicator on any intraday price chart as well as long-term price charts.
Step Chart RSI Indicator For MT5 Trading Signals
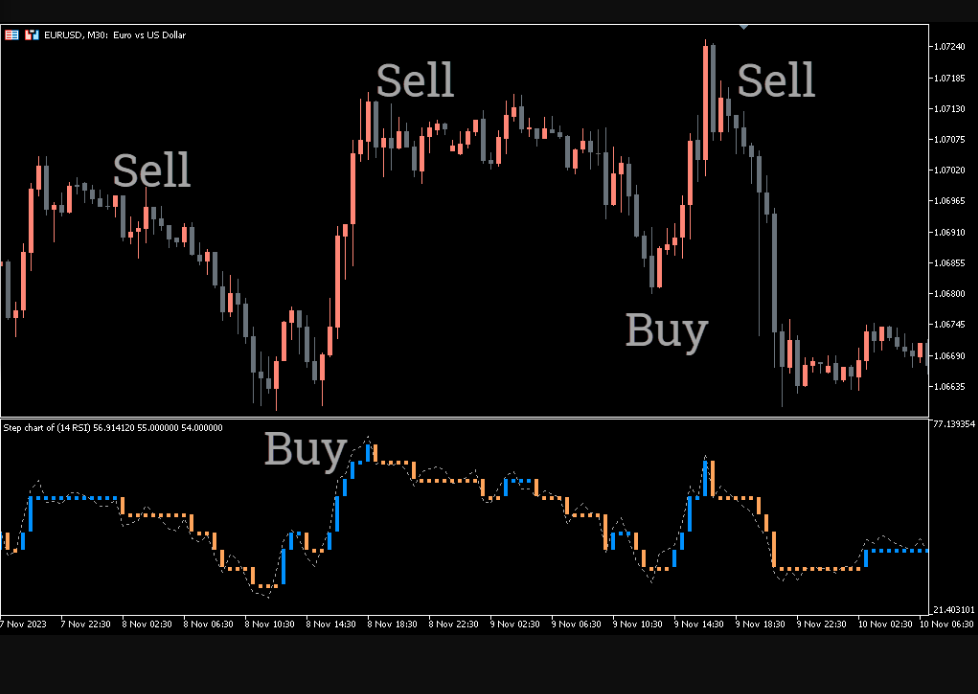
The indicator displays two lines: the blue RSI line and the orange signal line in a separate indicator window. The trading strategy is to enter the market when these lines cross after the indicator reaches overbought or oversold levels. Traders can calculate overbought and oversold levels according to their trading preferences.
If the price reaches an oversold level below 30 and reverses above 30, we expect the price to move higher. Therefore, traders should enter a buy trade with a stop loss below the previous swing low. In addition, traders should hold positions and aim to take profits at a level that is very opposite of the overbought level.
Traders can use a similar trading strategy for a sell trade once the indicator reaches above 70 and reverses.
Conclusion
Thus, the RSI Step Chart Indicator for MT5 helps forex traders to filter the trading signals generated by the classic RSI indicator. The best filter for forex traders using RSI for trading and technical analysis.
Reviews
There are no reviews yet.
Be the first to review “Step Chart RSI Indicator” Cancel reply
We use cookies to ensure that we give you the best experience on our website. If you continue to use this site we will assume that you are happy with it.Accept


Reviews
There are no reviews yet.