Standrad Deviation Indicator
Standard Deviation displays histogram bars to determine the direction of the trend.
The Standrad Deviation indicator appears in the data window. It works the same as any oscillator with overbought and oversold conditions.
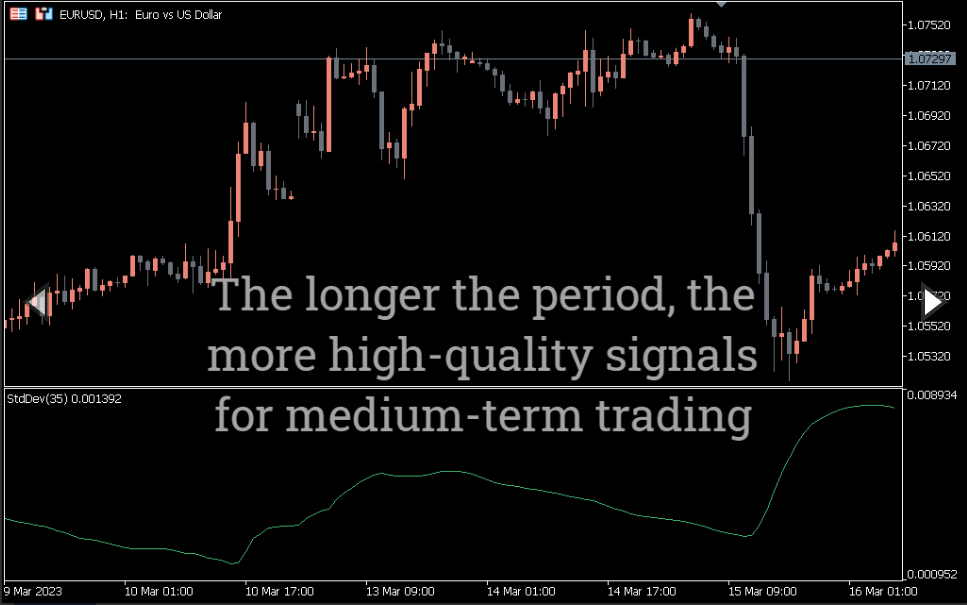
The indicator draws one line without restrictions or scale to trigger trading signals. The indicator can be used on any timeframe. However, higher time frames tend to be more accurate.
The indicator is based on a well-known statistical method called standard deviation.
How to use the Standrad Deviation for MT5?
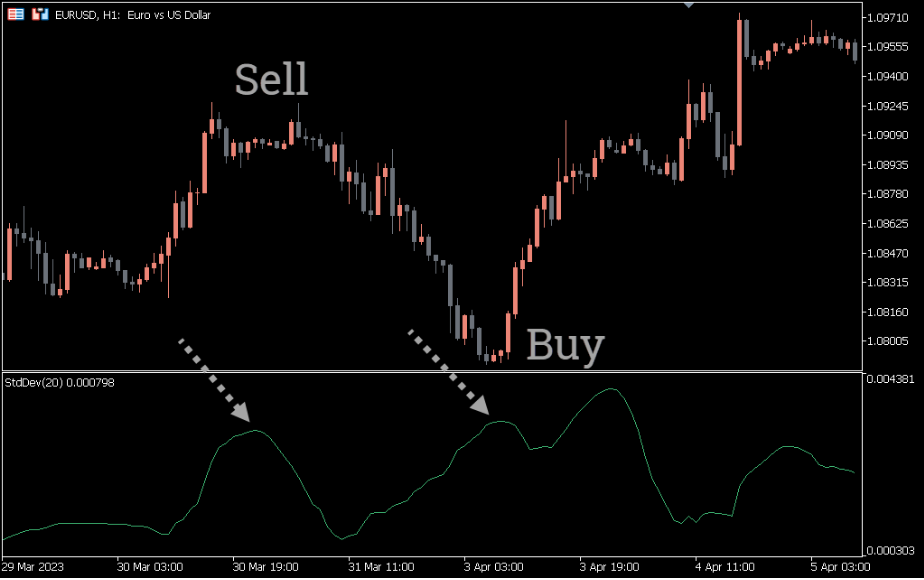
The below EURUSD H1 chart shows the BUY/SELL signals of the indicator.
The indicator measures the volatility of an instrument relative to the simple moving average. The indicator value oscillates around the zero value. Greater the distance from zero, the greater the volatility.
You can use Standrad Deviation in many ways. A common way is to interpret the directional bias of the market. Like, if the indicator value is above zero, the trend is bullish. Similarly, the trend is bearish if the value is below zero.
You may use the overbought and oversold conditions and candlestick patterns to trade the reversals.
When the Standrad Deviation line hits the bottom, wait for the line to turn upwards. Then wait for a bullish candle to close to enter the long position.
Similarly, when the indicator`s line hits the top, wait for it to turn south and then enter short on a bearish candle close.
Conclusion
The Standrad Deviation for MT5 has different utilities. You can use it as a trend filter or find reversals or breakouts. The success probability depends on many factors. Hence, backtesting is important.


Reviews
There are no reviews yet.