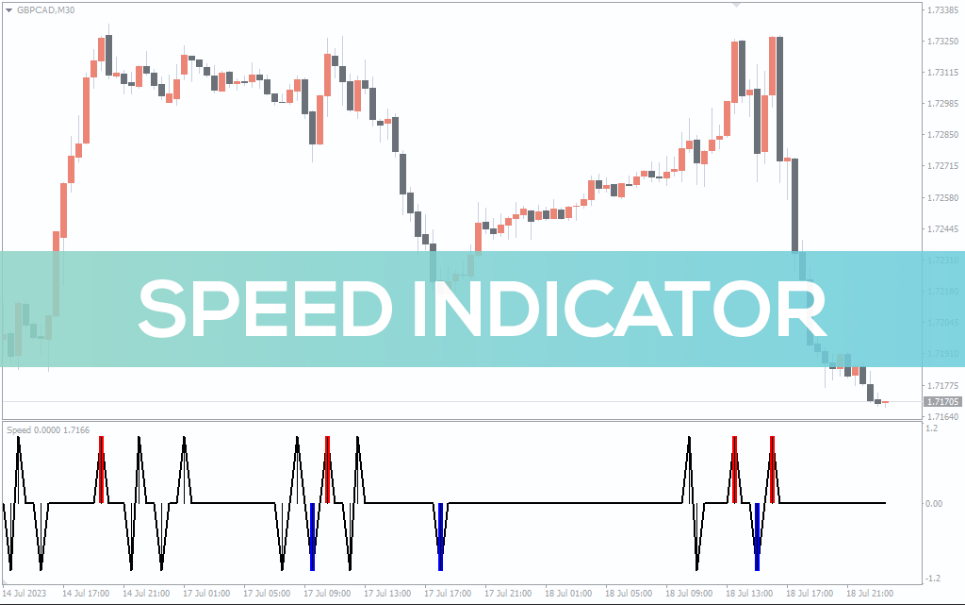
The Speed Indicator oscillates between certain levels to identify the speed and direction of the trend.
The Speed Indicator is an oscillator that determines the speed of the current trend. It oscillates between -1.2 and 1.2 and tells the speed of the current trend.
The indicator plots blue and red bars to show BUY/SELL signals. The red bar signifies the bearish trend while the blue bar illustrates the bullish trend.
Although you can use the indicator on shorter timeframes, it’s better to use it on longer timeframes to avoid false signals.
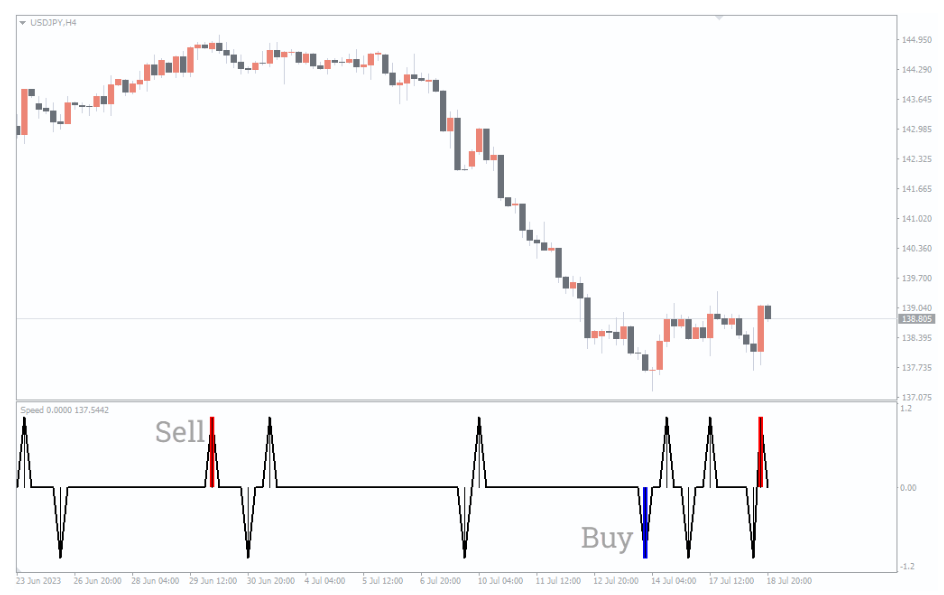
How to use the Speed Indicator for MT4?
The above USD/JPY H4 chart shows indicator’s BUY/SELL signals. As mentioned above, the indicator uses the blue and red bars to indicate BUY/SELL signals.
When a blue bar appears, it signifies a bullish trend, indicating that the market is experiencing upward momentum.
Conversely, a red bar represents a bearish trend, suggesting downward momentum.
You can also use the indicator to gauge the strength and duration of market trends. By monitoring the oscillating values between -1.2 and 1.2, you can check the intensity of the current trend, whether it is gaining or losing momentum.
Conclusion
The Speed Indicator for MT4 oscillates between -1.2 and 1.2 and tells the speed and direction of market trends. By plotting blue and red bars, it indicates bullish and bearish trends
Reviews
There are no reviews yet.
Be the first to review “Speed Indicator” Cancel reply
We use cookies to ensure that we give you the best experience on our website. If you continue to use this site we will assume that you are happy with it.Accept

Reviews
There are no reviews yet.