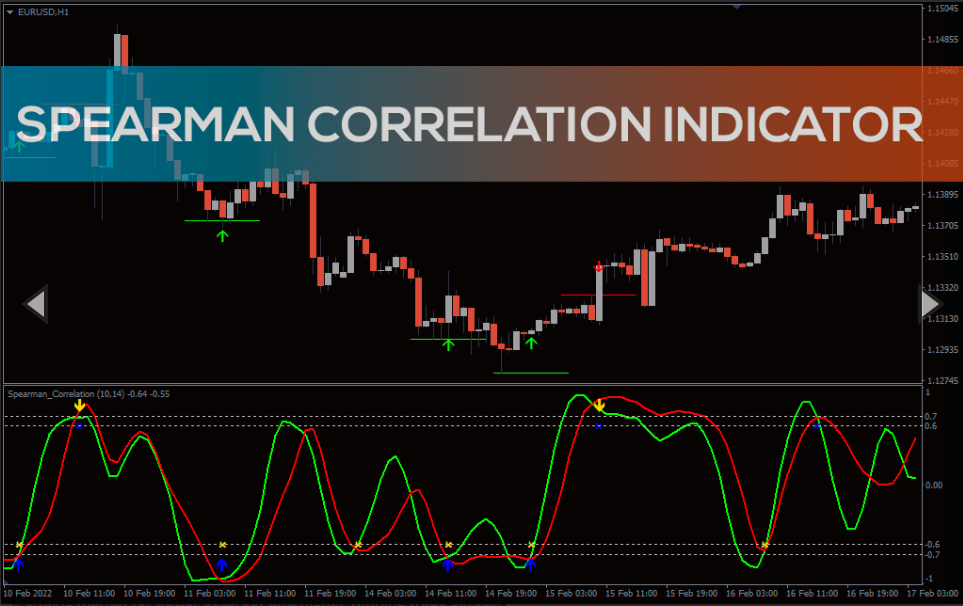
Spearman Correlation Indicator
Spearman correlation indicator for mtt4 – download free. Trend reversal indicator for mt4. Overbought/oversold mt4 indicator.
The Spearman Correlation indicator for MetaTrader is the best trend reversal tool that accurately highlights the extreme zones where the price of an asset may likely change direction.
What is the Spearman Indicator?
The Spearman Indicator is a technical tool developed based on the Spearman correlation principle. The indicator evaluates the strength and possible reversal zones of a trend by identifying the previous highs/lows correlation levels of an asset.
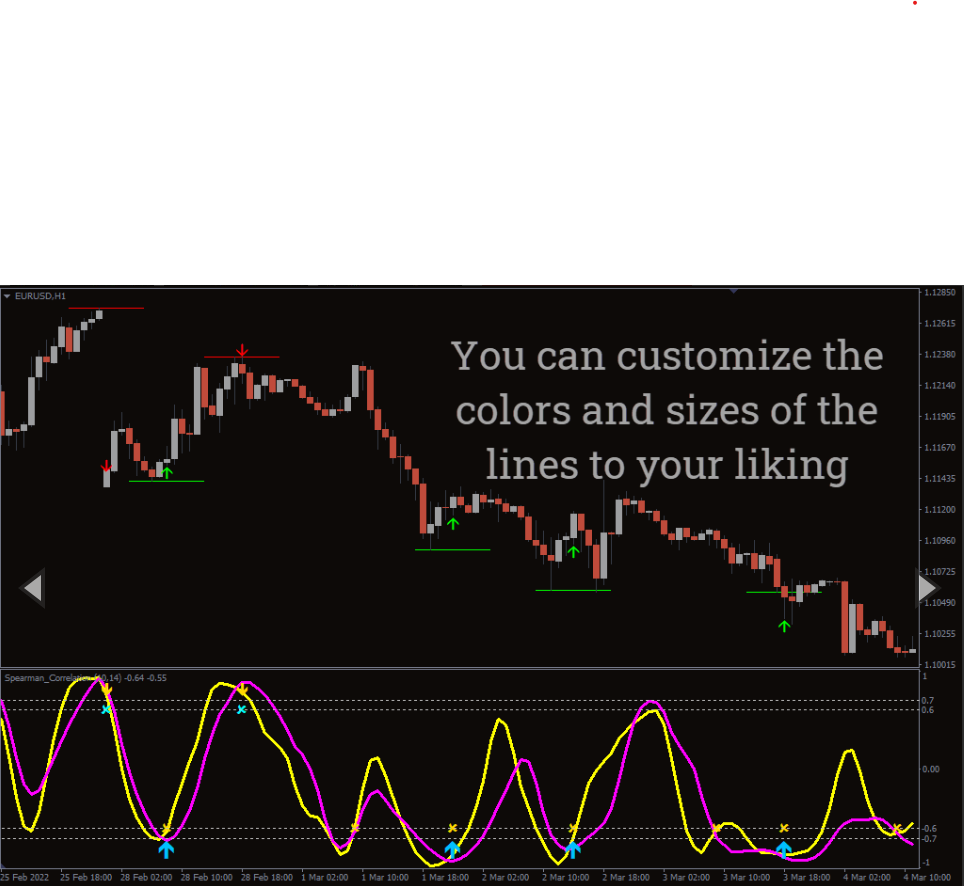
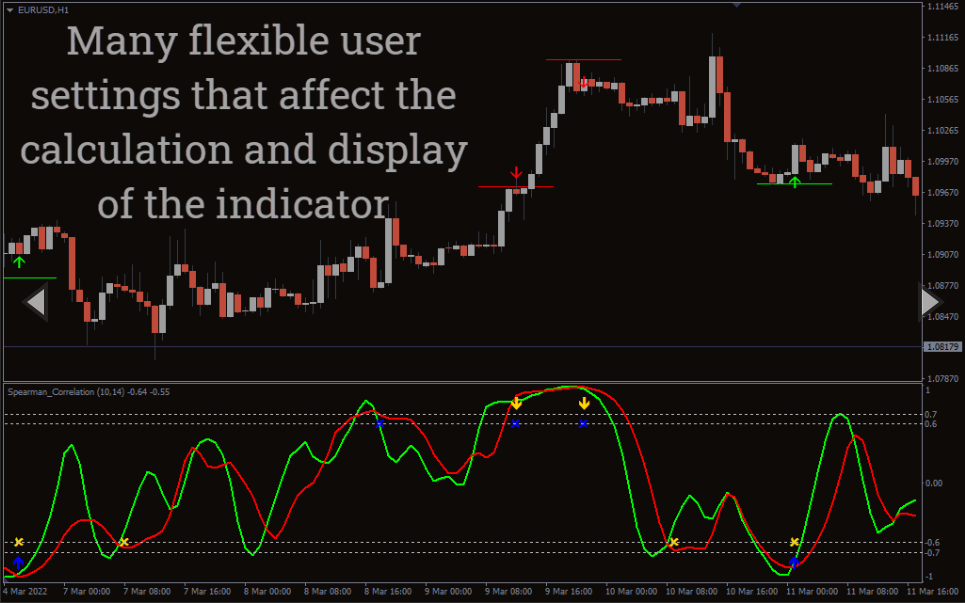
The indicator comes with two lines that oscillate between different zones (overbought/oversold levels) on the chart. It also comes with price bars and signal arrows to mark the potential reversal point of the price and arrows for BUY/SELL entries.
The Spearman Correlation indicator is highly responsive and almost lag-free. The indicator is recommended to be used in a trending market for better accuracy and higher-winning trade setups.
Furthermore, the indicator is recommended for both novice and experienced traders alike. It is also suitable for different trading styles like scalping, day/intraday, and swing trading.
Spearman Correlation BUY/SELL Signals
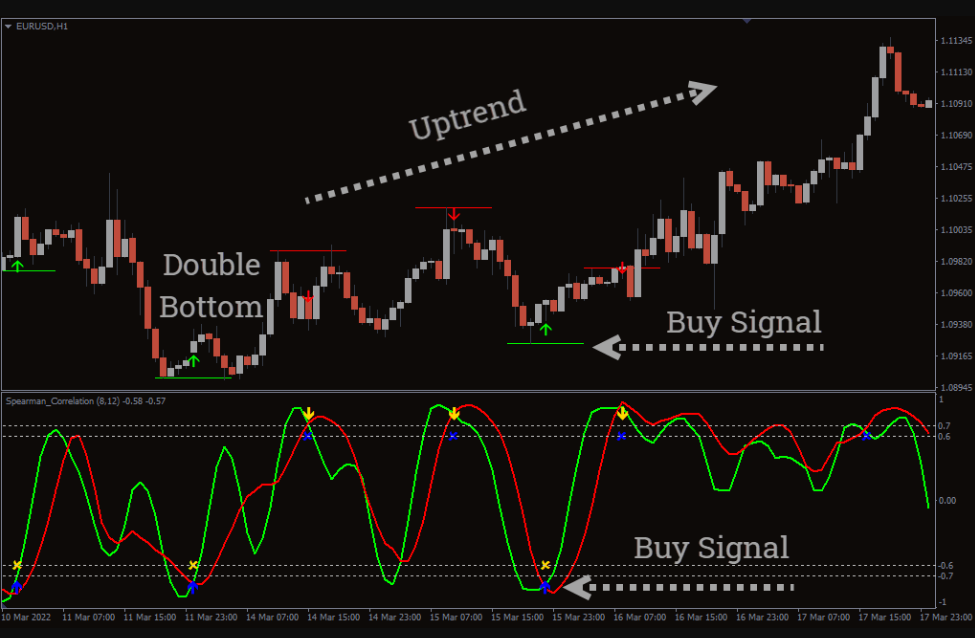
The above screenshot depicts how the indicator would look on your MT4 platform. It also illustrates how to identify high probability setups and entries.
The BLUE and GOLDEN arrows of the indicator suggest a possible bullish/bearish trend reversal respectively. Conversely, the LIME and RED arrows depict BUY/SELL entries respectively. Furthermore, the dotted dashes are the overbought and oversold zones.
BUY Signal: Firstly, ensure that the market is trending to the upside (bullish), then wait for the indicator to paint a lime-colored price bar on your chart. Now, wait for the two lines of the indicator to interact with the oversold level, and then cross over to the upside with an accompanying blue arrow.
With the above conditions, you may open a BUY/LONG position after the indicator also paints a BLUE signal arrow. You may refer to the above screenshot for more clarity.
SELL Signal: Firstly, ensure that the market is trending to the downside (bearish), then wait for the indicator to paint a red-colored price bar on your chart. Now, wait for the two lines of the indicator to interact with the overbought level, and then cross over to the downside with an accompanying golden arrow.
With the above conditions, you may open a SELL/SHORT position after the indicator paints a RED signal arrow.
Conclusion
The Spearman Correlation indicator for MT4 is an indicator that can help you to trade price reversals with better precision. What’s more, the indicator is free to download.
You must be logged in to post a review.

Copyright 2025
Reviews
There are no reviews yet.