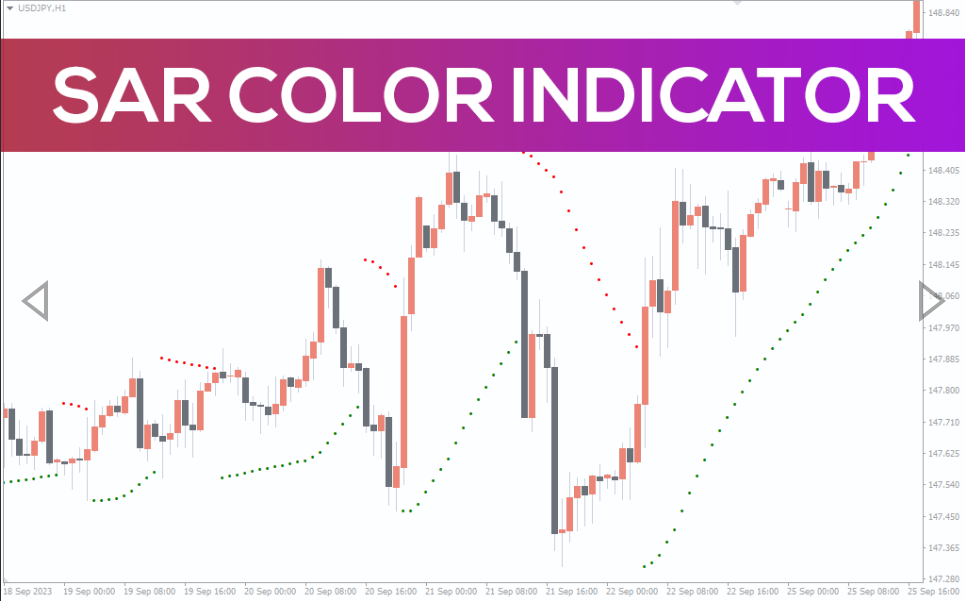
SAR Color Indicator
The SAR Color indicator is a Parabolic SAR that displays a green and red parabola (dot) on the chart.
The SAR Color Indicator is a variation of the popular Parabolic SAR indicator. The regular Parabolic SAR, also known as the “stop and reverse” indicator, paints a parabola (dot) below/above the price to depict an uptrend and downtrend, respectively.
Is SAR a good indicator?
The Parabolic SAR indicator is commonly used in the financial market to keep a tab on the current direction of the market and to identify the end/beginning of a new trend. It is also used as a signal to open or exit a trade position.
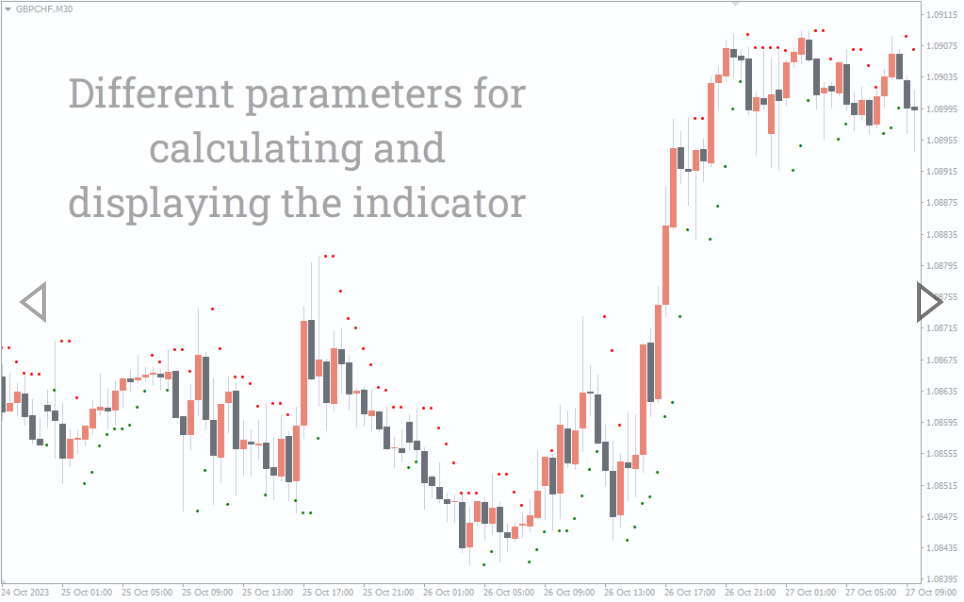
However, one of the downsides of the traditional Parabolic SAR is that it comes with a single color for uptrend and downtrend signals, which may not be convenient when used among other technical indicators.
Therefore, the SAR Color indicator is a Parabolic SAR designed with a dual color feature to display the uptrend and downtrend of an instrument in different colors. So, a bullish trend is depicted with a green parabola, while a bearish trend is posited with a red parabola.
How to Trade with the SAR Color Indicator
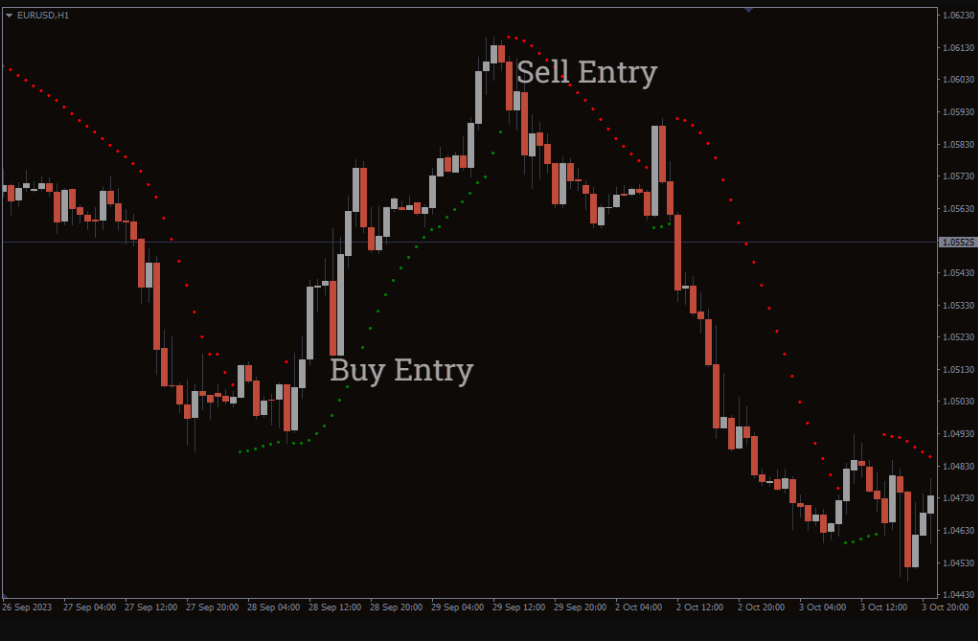
The attached image is the SAR Color indicator; it paints a green parabola for uptrend and red for downtrend.
Therefore, open a buy/sell trade position when the green/red parabola is displayed below/above a candlestick. However, combining the indicator with price action or other trend analysis indicators is recommended for better efficiency.
Furthermore, it is worth mentioning that this indicator gives better market analysis/entry signals in a stable trend (bullish/bearish) condition.
Conclusion
The SAR Color indicator is a beginner-friendly technical tool that displays two distinct colors of parabolas for a bullish and bearish trend condition. Finally, it is free to download.

Reviews
There are no reviews yet.