How do you read the RSI Candles Smoothed ?
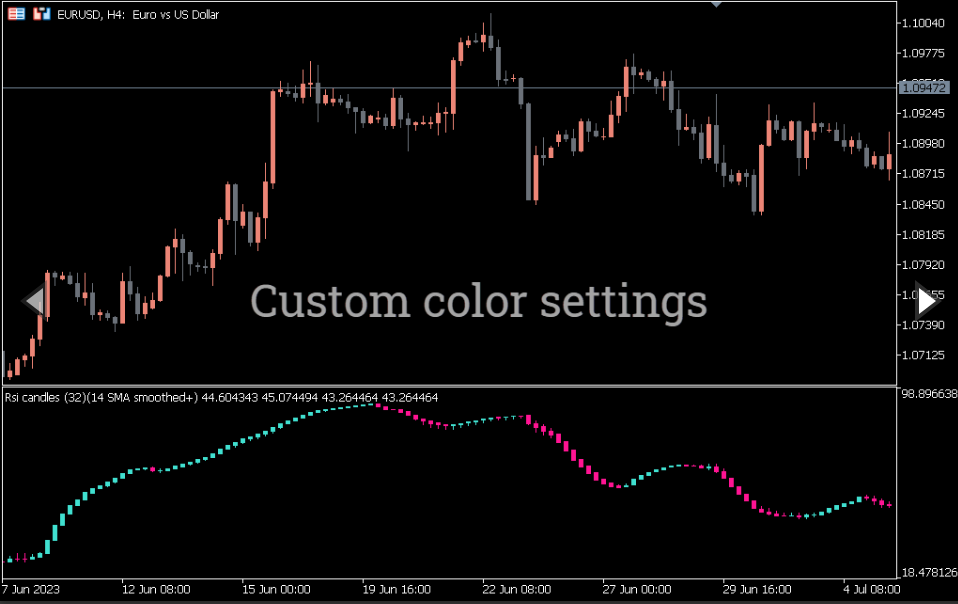
The indicator focuses on the level 50 of the RSI value. A bullish sentiment is indicated when the RSI rises above 50.00, while a bearish sentiment is shown when it falls below 50.00. To make it visually clear, the indicator changes the color of the current bar to blue if the RSI value is above 50.00, and to red when it falls below.
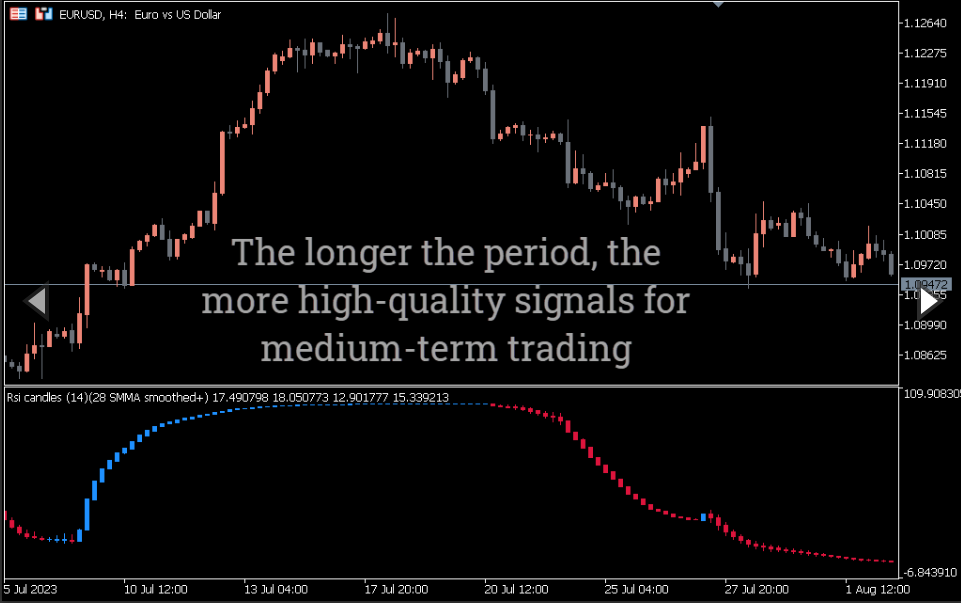
When analyzing the trend on the EURUSD pair using this indicator, the chart demonstrates a continuous bearish trend indicated by red bars consistently below the 50 level.
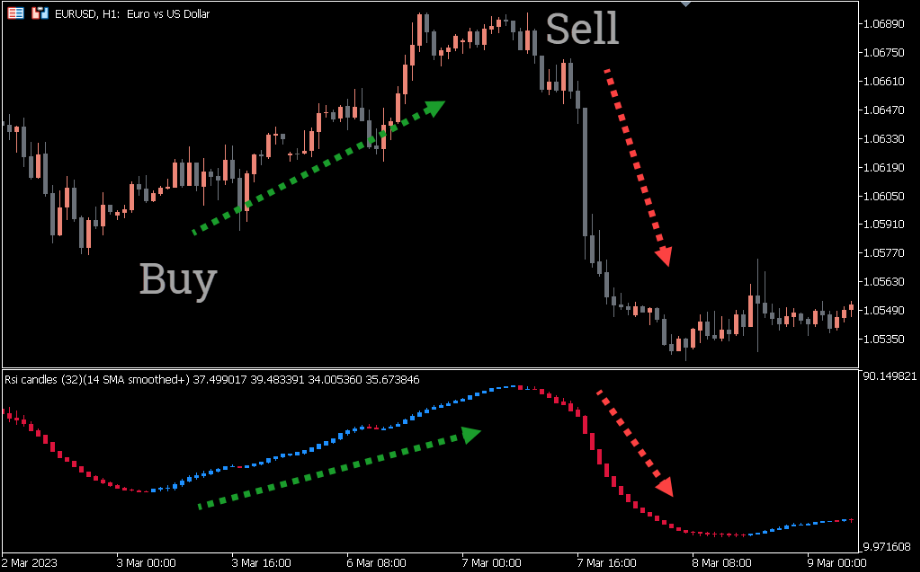
It is important to use the indicator in conjunction with other technical analysis tools, such as price action, for accurate trading decisions. In the example provided, price action was used alongside the indicator to identify a selling opportunity.
Conclusion
The RSI Candles Smoothed Indicator for MT5 offers a convenient way to observe bullish and bearish sentiment based on the relative strength index, with the added benefit of a smoother display.


Reviews
There are no reviews yet.