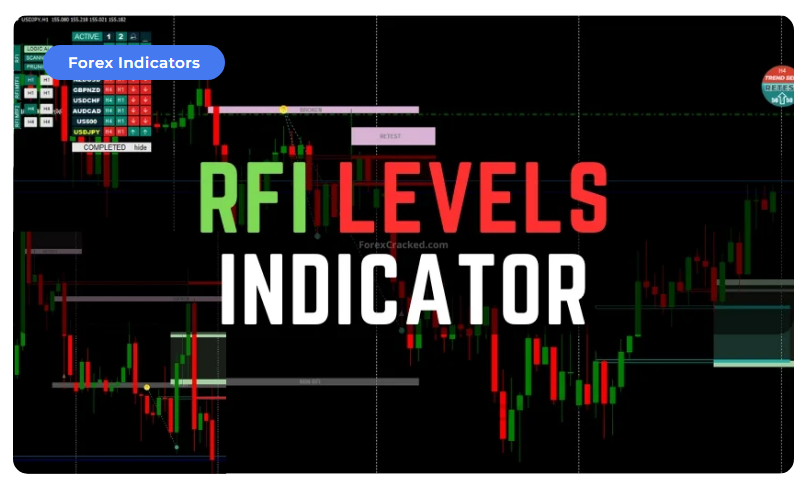
RFI Levels Indicator
What Does the RFI Levels Indicator Do?
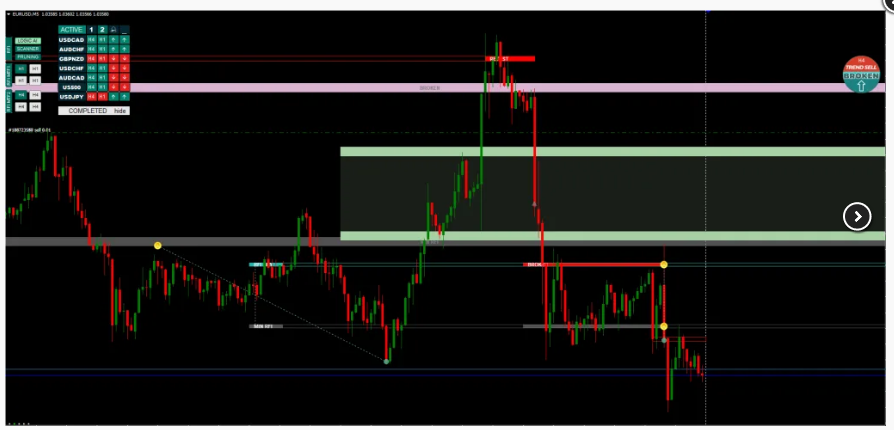
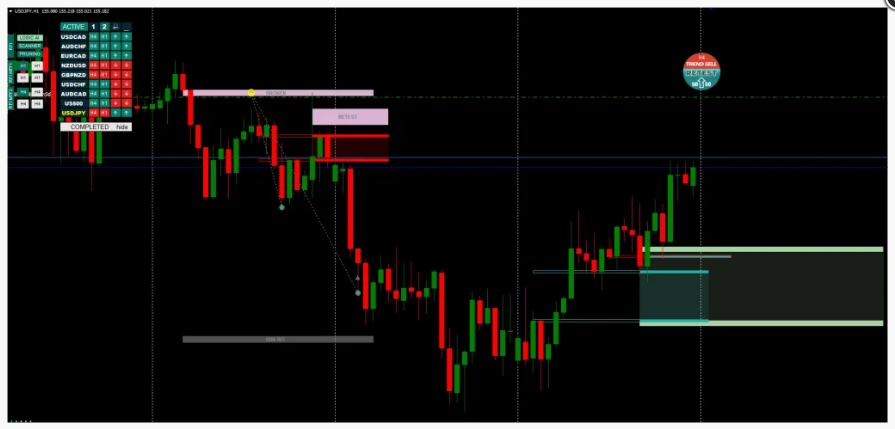
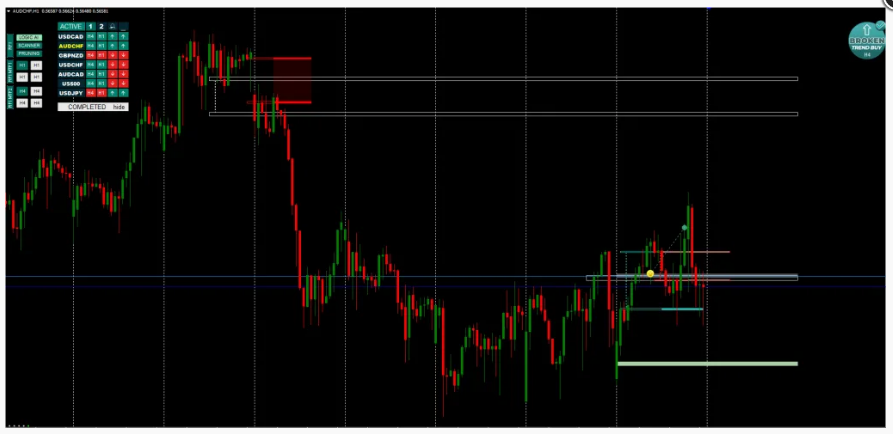
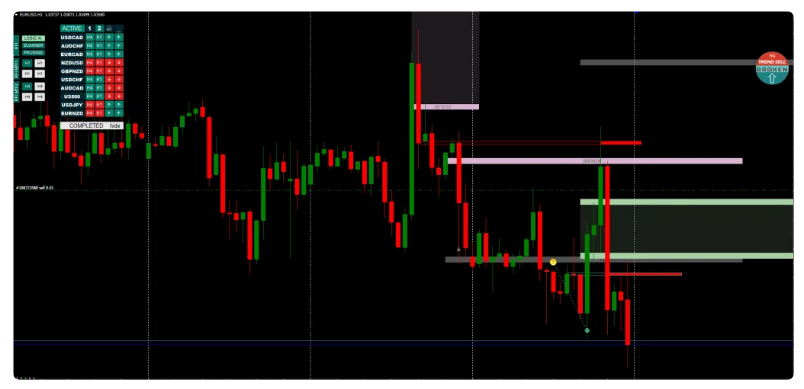
Shows Active Buying and Selling Zones – The indicator highlights important price zones where buying or selling pressures are active. Once these zones are triggered, the indicator changes its colors and shades, making it visually clear what’s happening. To make it even easier, arrows appear to guide you toward potential trade opportunities.
Includes Higher-Timeframe Zones – Sometimes, traders want to see price zones from a bigger-picture perspective. With the Multi Timeframe mode, the indicator lets you view key levels from higher timeframes while still trading on your preferred chart.
Provides a Pro Trading Algorithm – The indicator comes with a step-by-step algorithm. This algorithm is designed for intraday trading and can work with both trend-following and counter-trend strategies. Simple templates and instructions explain the process for entering trades.
Works on Any Timeframe – Whether you’re a scalper looking at 1-minute (M1) charts or a long-term trader analyzing monthly (MN) charts, the RFI Levels Indicator adapts to your needs.
Alerts and Notifications – Never miss a trade again! The RFI Levels Indicator provides graphic and sound alerts. It can also send notifications to your mobile phone, making it easier to stay updated even when you’re away from your desk.
Active Pattern Scanner – With its built-in pattern scanner, the indicator monitors multiple timeframes and alerts you when trading setups align in a single direction. This saves you the time and stress of manually searching for patterns.
Why Is It Useful?
The RFI Levels Indicator is designed for both experts and beginners. Thanks to its step-by-step video guides and examples, it’s simple to use. Even if you’re new to trading, you can quickly understand how to use it.
Here’s how it helps traders:
Combine Insights for High Success Rates – By waiting for specific patterns (like RETEST, BROKEN, or MIRRORED) to form at the RFI levels. You increase your chances of entering successful trades. When paired with the LOGIC AI signal, which identifies optimal conditions, your success rate can reach as high as 80-85%.
Find the Best Entry Points – It highlights areas where prices will likely reverse or continue moving, allowing you to enter lower-risk trades.
Set Accurate Targets – It helps you identify where to take profits, ensuring that you exit trades at the right time.
Understand Market Logic – Prices often move logically from one key level to another. RFI levels help you recognize these movements, so you’re not guessing where the market will go next.
How Does It Work?
RFI Levels – The Foundation
RFI levels are price zones with maximum trading volume, where major players make their moves. These zones are key areas for identifying potential reversals or continuation trends.
Trading Patterns – The Confirmation
After spotting an RFI level, traders wait for a breakout or retest of that zone. Patterns like RETEST, BROKEN, or MIRRORED confirm that the market is reacting to the level, signaling it’s time to take action.
LOGIC AI – The Assistant
LOGIC AI is an automated signal system that combines multiple factors, including trends and timeframes, to pinpoint the best opportunities. It marks these moments with circles or triangles, aligning with the RFI levels and trading patterns to provide clarity.
Conclusion
The RFI Levels Indicator simplifies trading by breaking down complex market behavior into easy, actionable insights. It’s a tool for beginners who need step-by-step guidance to experienced traders looking to enhance precision.
It’s a comprehensive trading assistant with features like visual alerts, multi-time frame analysis, and pattern recognition. By focusing on high probability setups and offering clear strategies, the RFI Levels Indicator helps traders make informed decisions, reduce risks, and improve overall accuracy.
You must be logged in to post a review.

Copyright 2025
Reviews
There are no reviews yet.