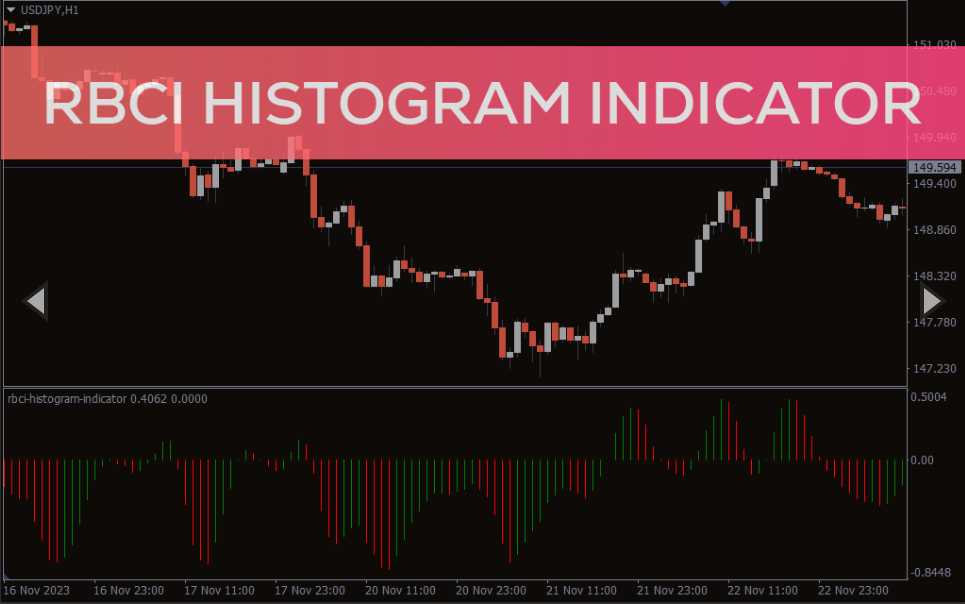
RBCI Histogram Indicator
RBCI Histogram Indicator For MT4 shows trend direction, strength, and bullish and bearish forex trading signals using buying and selling pressure
The RBCI histogram indicator for MT4 shows the buying and selling pressure and provides forex trend trading signals. RBCI – Relative Breadth Cycle Indicator shows the trend direction, early warning of trend direction change and trend strength. As a result, forex traders can derive precise entry points and have a clear understanding of the current trend.
The indicator works well for new and advanced forex traders. Moreover, it is simple to understand and adapts to all intraday price charts as well as the daily, weekly and monthly charts. Since the indicator reflects the buying and selling pressure of the market, traders can use this indicator to formulate auto trading strategies.
RBCI Histogram Indicator For MT4 Trading Signals
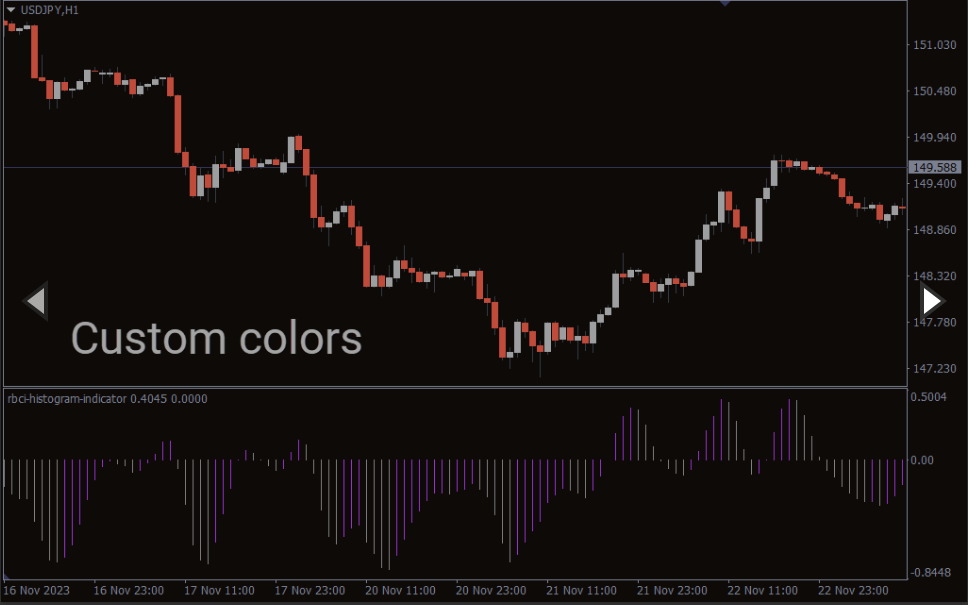
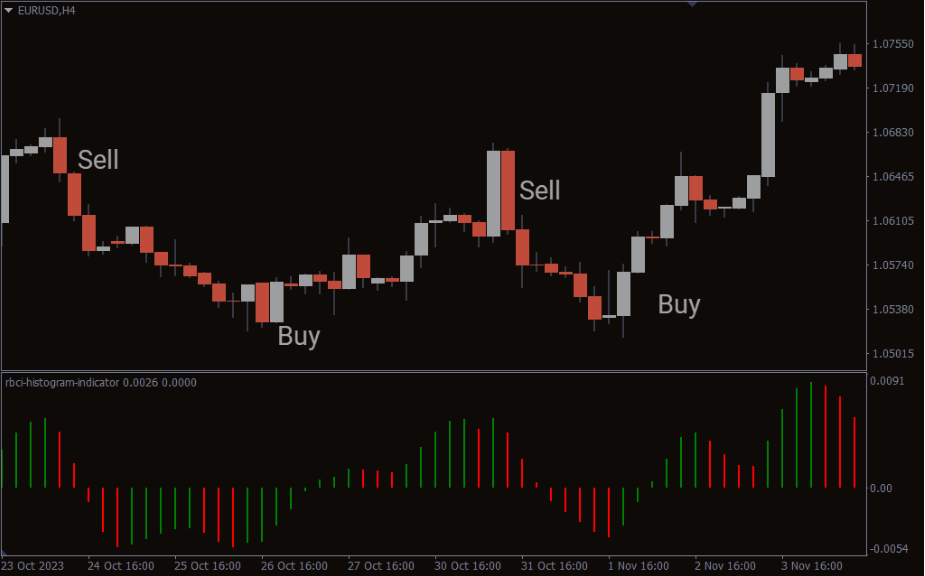
The indicator plots a Green and Red histogram with a ZERO line. The distance of the histogram from the ZERO line indicates the strength trend. The far the histogram bar is the stronger the trend. Furthermore, the color of change of the candle acts as an early warning of trend change. However, the trading strategy is to enter the markets based on the appearance of the histogram above or below the ZERO line.
If the green histogram appears above the ZERO line it indicates a bullish market trend. So, forex traders should consider entering the markets with a buy trade with a stop loss below the previous swing low. Additionally, traders should book profits at an opposite trading signal or appearance of an opposite color bar or with a good RR.
A similar trading strategy works well in case of the appearance of a bearish histogram bar below the ZERO line.
Conclusion
In summary, the RBCI indicator for MT4 is an essential tool for forex trend traders. It helps to understand the direction, strength, depth of trend and early warning of its change.

Reviews
There are no reviews yet.