RBCI Hist Indicator
The RBCI Hist Indicator for MT4 detects the bullish and bearish strength and buying/selling opportunities in the market.
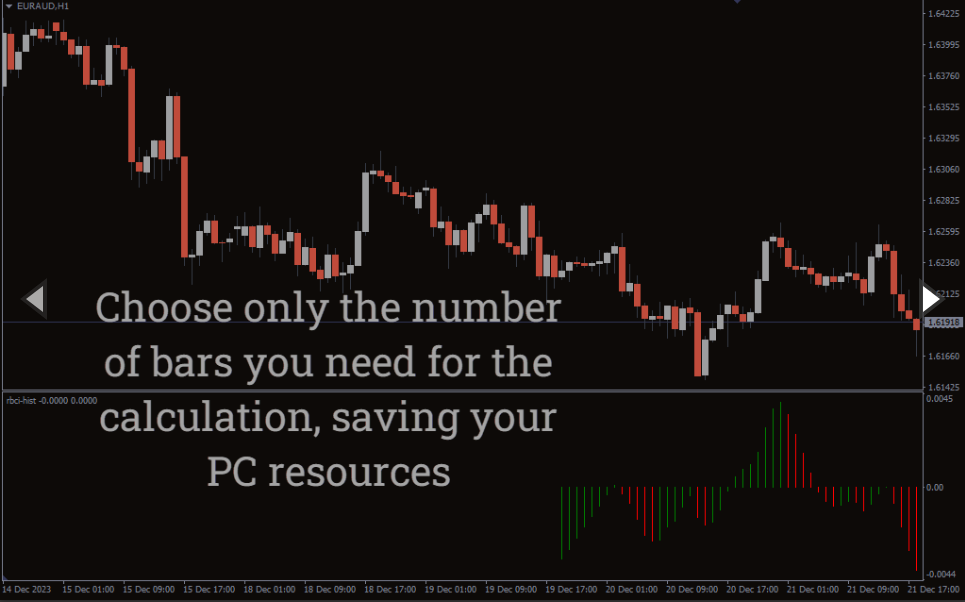
The RBCI Hist Indicator is a MetaTrader 4 (MT4) trading tool that measures the differences between the buying and selling pressure in the financial markets. It keeps a tab on the market momentum to identify the trend and strength of a financial instrument.
The indicator’s histogram bars fluctuate between positive and negative zones separated by a zero line. The histogram bar above the zero line depicts a positive zone, which suggests more bullish buying pressure.
Conversely, the histogram bar below the line indicates a negative zone, which suggests selling pressure. Furthermore, the indicator is ideal for beginners, intermediate, and advanced Forex traders.
How to Trade With the RBCI Hist Indicator
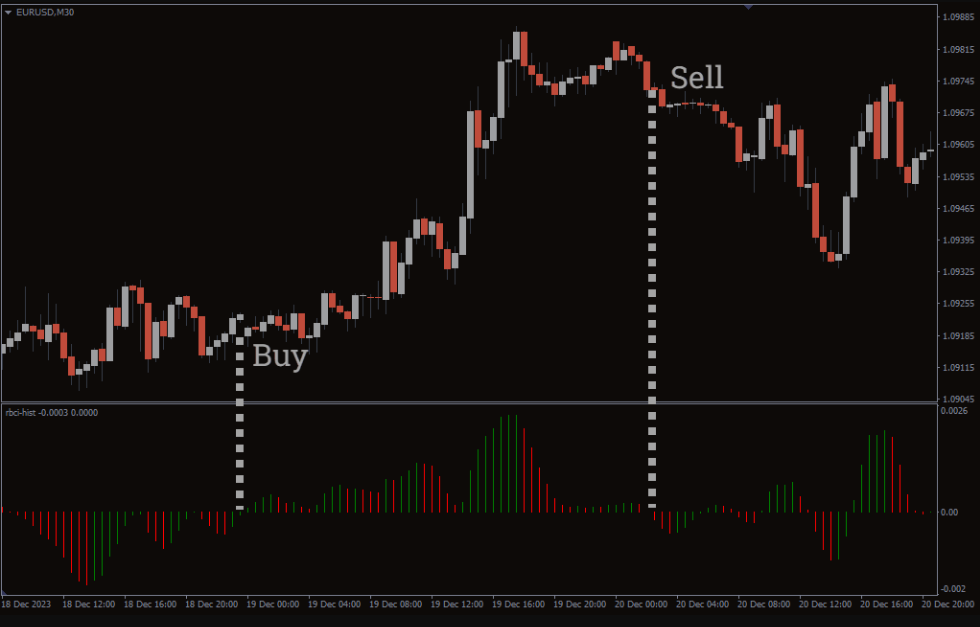
The above image shows the buying and selling strength analysis of the EUR/USD currency pair in the M30 timeframe.
The RBCI Hist indicator can be used to identify potential buying and selling signals when the histogram crosses above/below the zero line or when the price forms a divergence with the histogram.
Therefore, consider buying an instrument when the histogram forms a positive divergence from the market price. Similarly, look for a selling opportunity when the histogram forms a negative divergence from the market price.
Furthermore, you can look for a buying opportunity when the histogram crosses above the zero line or sell an instrument when it crosses below. In addition, the indicator is recommended to be used as a confluence with price action/other trend-following indicators to mitigate false signals.
Conclusion
The RBCI Histogram Indicator for MT4 provides reliable market trend direction and potential reversal signals using the bullish and bearish market pressure. Nevertheless, ensure to manage your risk to protect your trading capital from significant losses on bad trades.
Joshua A. Francis

Reviews
There are no reviews yet.