Forex BUY and SELL signals from the best R Squared Indicator. Find overbought and oversold levels.
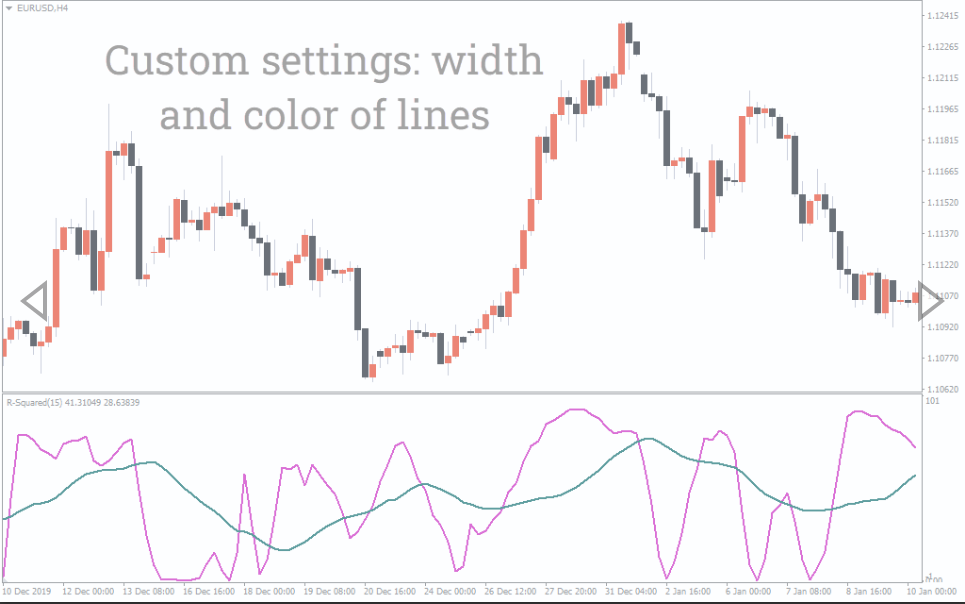
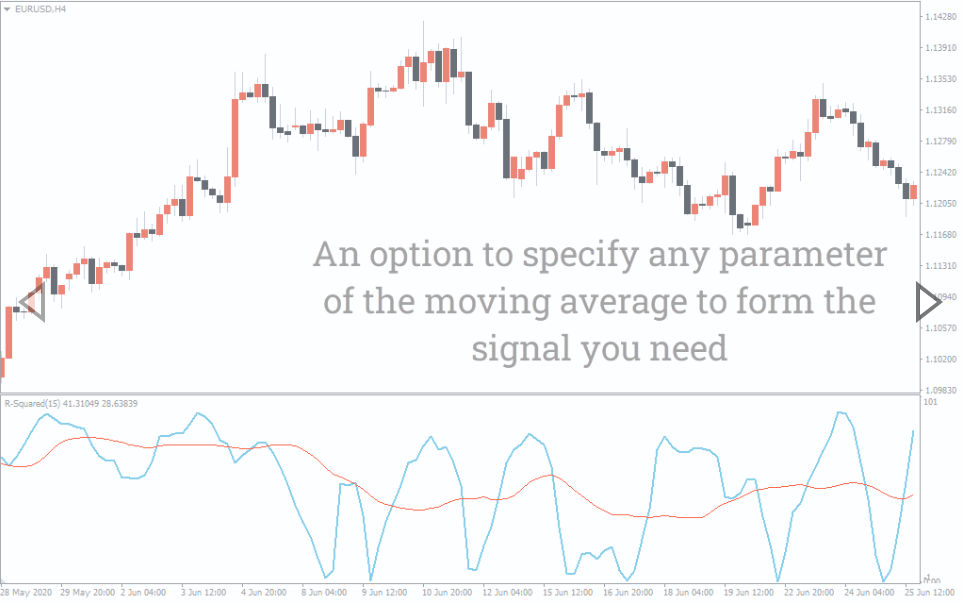
The R Squared Indicator is a simple oscillator that tells the overbought and oversold levels. R Squared belongs to a family of oscillators and works similarly to the RSI or Stochastics. The indicator oscillates between 0 and 101 with two trend direction signal lines. The lines are the length and Smooth, both having a similar period.
Traders can apply the indicator on any timeframe. However, applying the Indicator works best on longer timeframes.
R Squared Indicator BUY/SELL signals
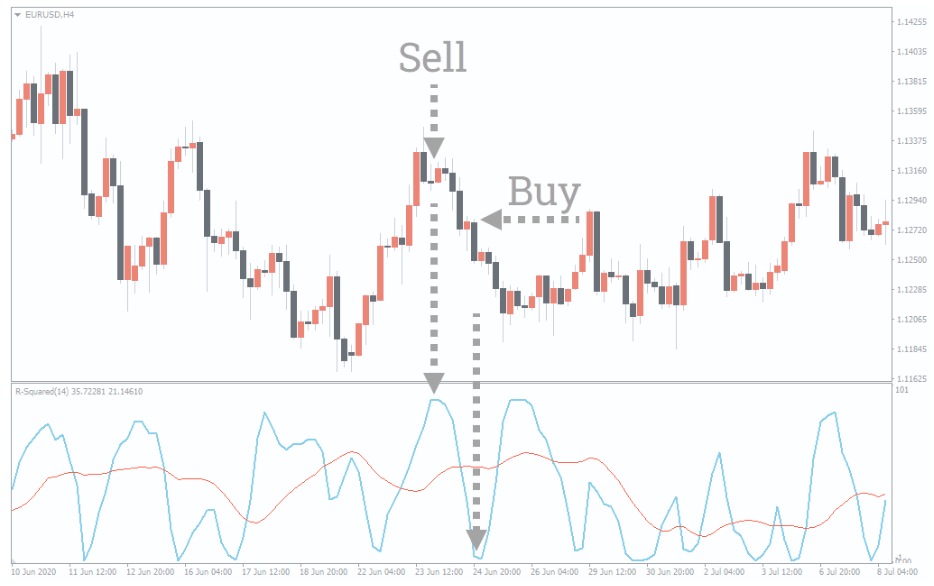
The above EUR/USD H4 chart shows BUY and SELL signals with the indicator. To determine the BUY and SELL signals, traders must identify oversold and overbought regions. As mentioned earlier, the R Squared indicator oscillates between 0 and 101. When the signal line is closer to the 101 level, it indicates an overbought level. Here traders can enter short or exit long positions.
Conversely, when the signal line reaches near the 0, it’s a sign of an oversold condition, and here traders can enter long or exit short positions. Even though the Indicator works best, it’s better to apply it with other indicators like the MA or the RSI. It is because the indicator is prone to false signals.
Conclusion
The R Squared Indicator is a momentum oscillator that tells about the overbought and oversold levels. Traders can take their positions by identifying these levels. You can download the indicator for free from our website
Reviews
There are no reviews yet.
Be the first to review “R Squared Indicator” Cancel reply
We use cookies to ensure that we give you the best experience on our website. If you continue to use this site we will assume that you are happy with it.Accept


Reviews
There are no reviews yet.