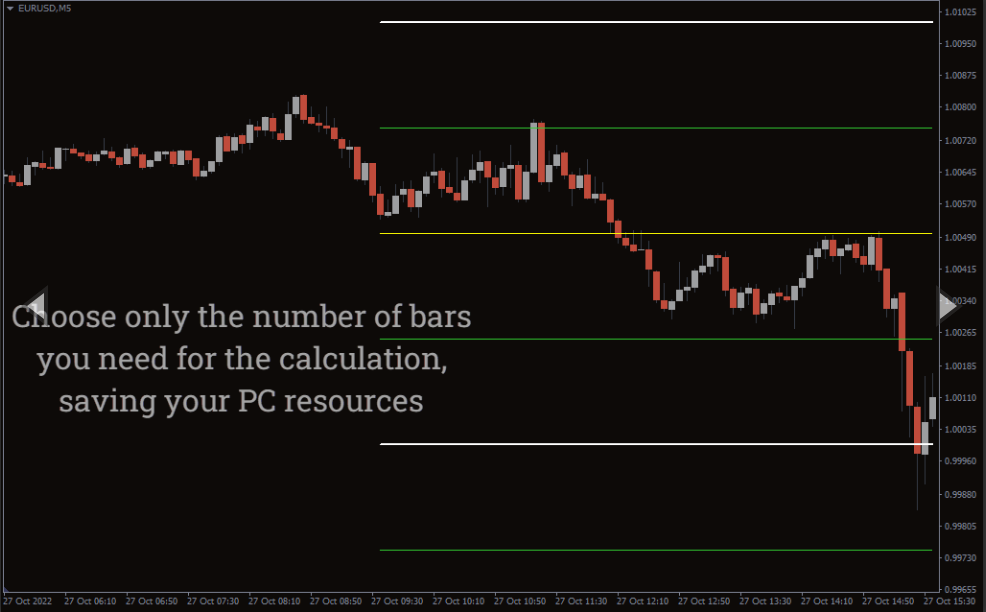
Quarter Theory MT4 indicator enables you to determine hidden support/resistance levels on MTF charts. Suits both forex and stock price-action trading strategies.
The Quarters Theory is an automatic market cycle detector that plots solid support/resistance levels on MT4 charts. Technical analysts consider support and resistance levels critical in determining market sentiments and supply/demand positions. These levels also help us assess buy-sell, stop-loss, and potential profit target zones. This guide will explain how to make correct trading decisions using the Quarters Theory MT4 indicator.
How to trade forex and stocks using the Quarters Theory indicator in MT4
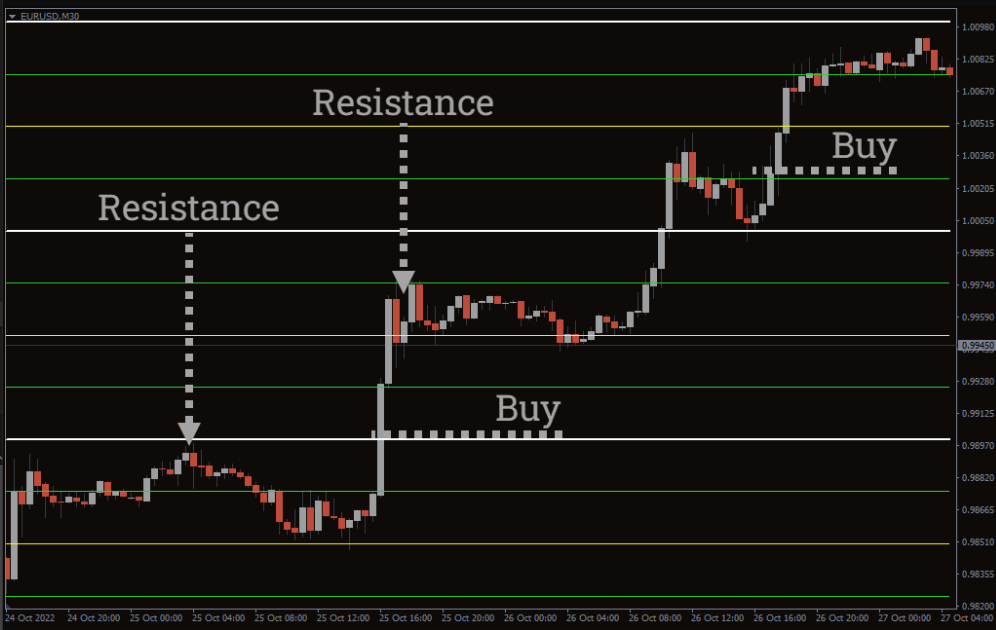
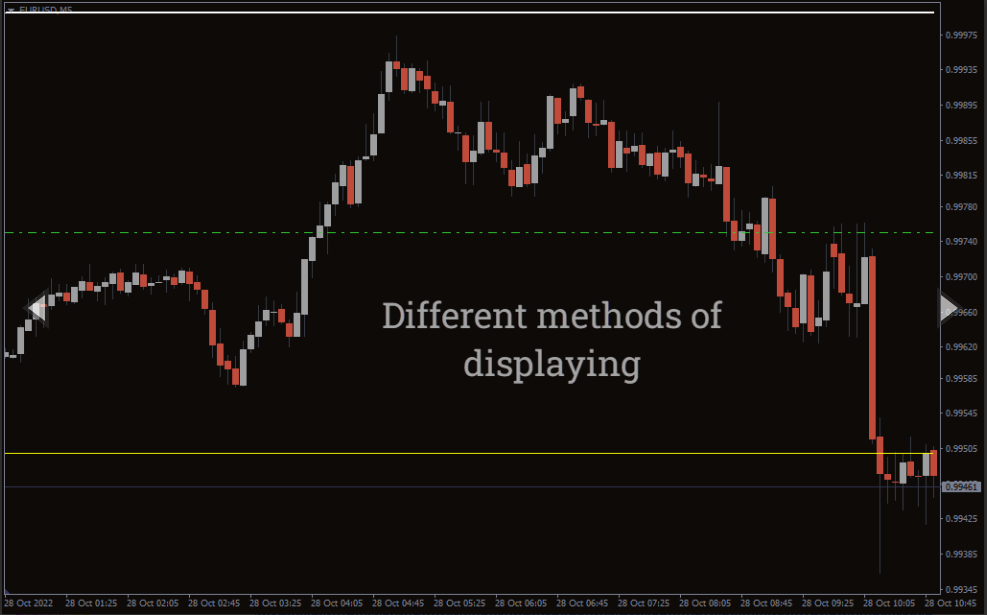
The Quarter Theory plots three types of horizontal levels showing different support/resistances in multiple colors. The major levels appear as white lines, the half levels as yellow lines, and the quarter levels as green lines. The white lines are divided in half to produce the yellow lines, and the yellow lines are split in half to create the green quarter lines.The above EUR/USD 30-minute chart demonstrates how to trade price breakouts using the Quarters Theory. During bullish market trends, prices keep moving upward, transforming resistance into support. Each time the price exceeds a resistance, it offers a buying opportunity, as shown in the above example. Besides bullish or bearish breakouts, it also identifies possible price retracement zones and potential profit targets for your buy-sell entries.
Conclusion
The Quarters Theory is the best indicator for price action traders who need help determining key market levels while anticipating buy-sell entries. Besides, it saves time by helping you avoid manually drawing support/resistance levels. Besides entries, it also points to potential trade exit levels.
Reviews
There are no reviews yet.
Be the first to review “Quarters Theory Indicator” Cancel reply
We use cookies to ensure that we give you the best experience on our website. If you continue to use this site we will assume that you are happy with it.Accept


Reviews
There are no reviews yet.