Price Patterns Indicator
Perfect price patterns detector. A suitable indicator for potential price continuation and reversal.
The forex market makes price patterns that replicate shapes. It is quite surprising that these shapes are valuable; you can use them for trading profitably. Essentially, the price action forms these peculiar shapes depending on the interaction of different market forces. These price patterns have been tested historically and tend to have an edge that traders can take advantage of.
Now, the problem is identifying these patterns in the market. The forex market tends to move haphazardly, and singling out a pattern is not a cakewalk, especially if you are a newbie. This is where the Price Patterns indicator comes in.
You can use the indicator to trade any currency pair. However, while you can use the indicator on any time frame, it works best for a longer time frame. Essentially, patterns that form on 4-hour, daily, weekly time frames tend to be more potent.
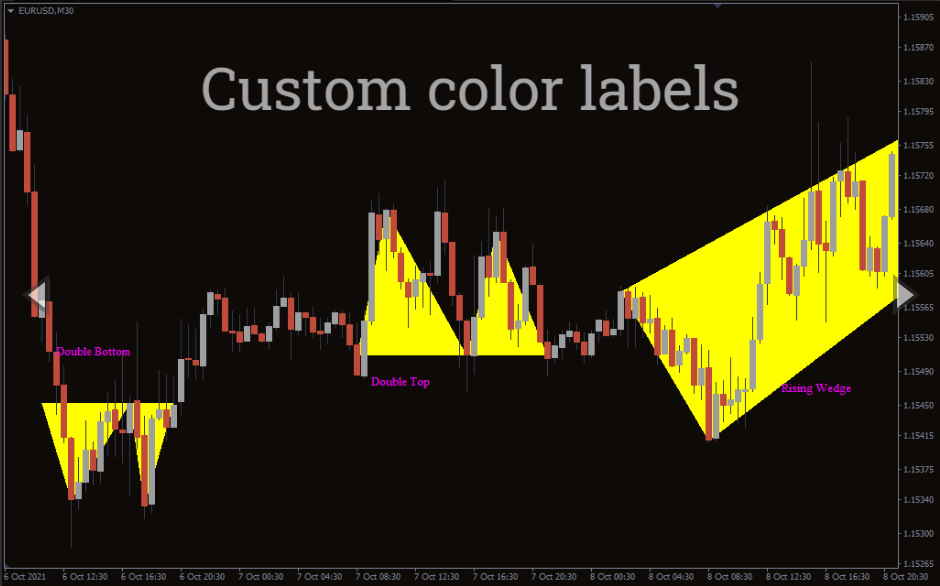
How to Use the Price Patterns indicator
The Price Pattern indicator scans the price chart and identifies the various price patterns. It labels and shades the patterns making them easy to identify. To be more precise, a price pattern that signals a potential trend reversal to the upside is a good buy signal.
To give an example, if a triple bottom forms around the support zone, you should be ready to buy. Similarly, a triangle pattern in an uptrend is a signal of trend continuation. You should therefore get ready to buy or add positions. On the other hand, the head and shoulder price pattern indicates a potential trend reversal into a bearish market. Therefore, it is a good sell signal.
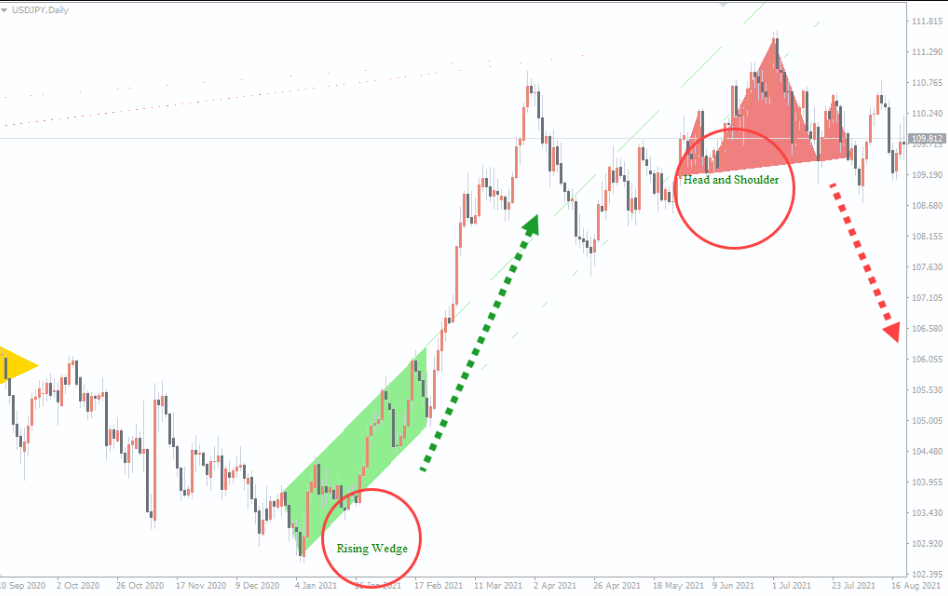
Trading Example
The chart above shows the price movement for the US dollar against the Japanese Yen. The chart forms a rising wedge, as shown by the area shaded green. The wedge pattern is a signal for a trend continuation. In fact, the price increased significantly after the formation of the wedge pattern.
Similarly, the market forms a head-and-shoulder pattern, shown by the area shaded light coral. The head and shoulder pattern is a signal of potential trend reversals into a bearish market. Therefore, the bears are set to push the price downwards, and you should be ready to place a sell order. Place your stop loss above the head (topmost peak).
Final Words
The Price Patterns indicator is an incredible tool for price action traders. It is simple to use and time-saving. You do not have to necessarily cram all the price patterns. The indicators identify the patterns for you. Simply place your trade depending on the existing signal. It is prudent to incorporate it into your trading strategy.
You must be logged in to post a review.

Copyright 2025

Reviews
There are no reviews yet.