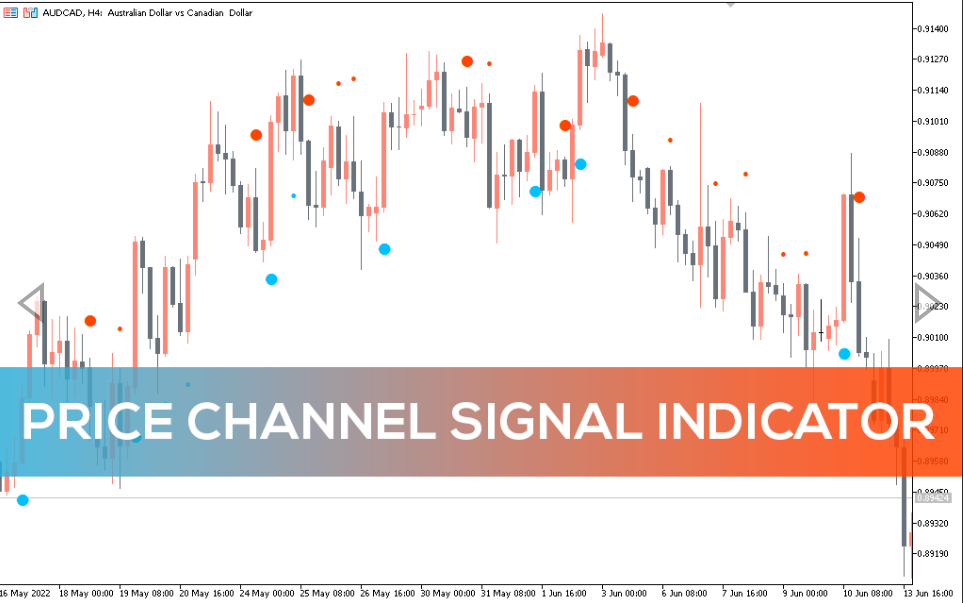
Price Channel Signal Indicator
The Price Channel Signal Indicator helps Forex traders to easily identify trends and when to open and close trades.
Categories: Trend, Signal, Channels, MT5
Trend trading is the most profitable forex strategy trading. This is due to the fact that the market moves in a trend, forming highs and lows of fluctuations at all time intervals. As such, most forex traders always follow trends by identifying swing highs and swing lows.
There are many forex strategies and indicators that help traders identify and trade trends. These strategies and indicators can be too difficult to understand or even confusing, especially for beginners. However, the Price Channel Signal Indicators for MT5 help traders easily identify trends and entry points.
Foundation
The Price Channel Signal Indicator helps Forex traders to easily identify trends and when to open and close trades. This indicator identifies trends by showing swing highs and lows. This allows traders to know when the market is in an uptrend or downtrend.
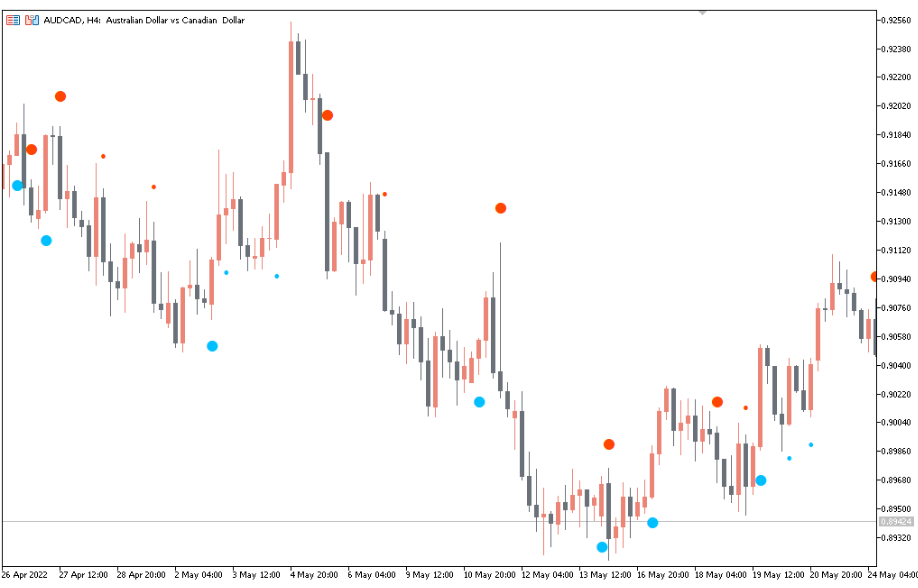
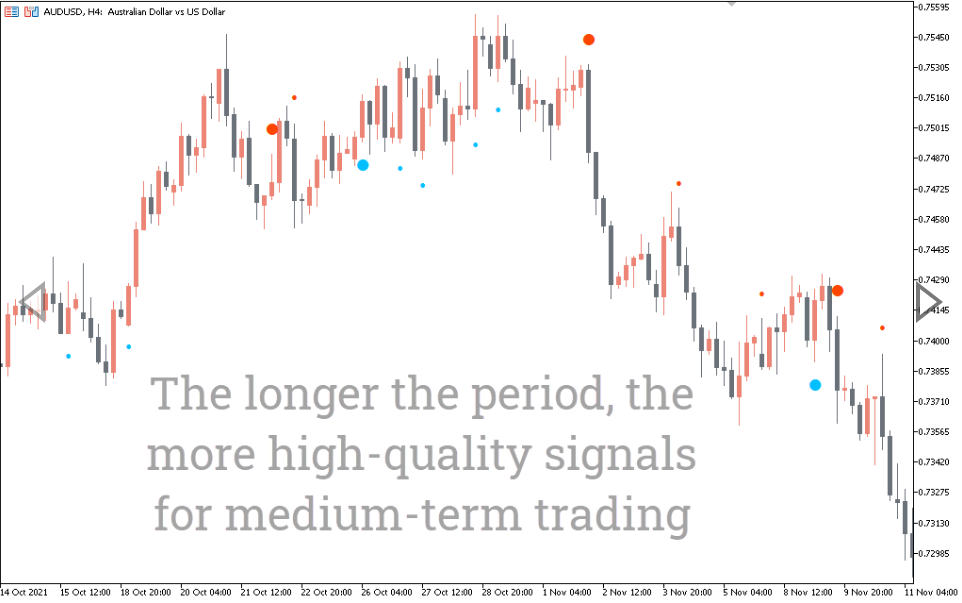
The chart below shows the price channel signal indicator on the AUDCAD H4 chart.
In the chart above, the red dots indicate a downtrend and thus signal sell trades. It simply means that the bull trend has ended and the bear market has begun.
therefore, the aqua dots displayed on the chart signify the start of an uptrend and thus signal buy trades. This is a sign that the market has ended its bearish move and a bull market has begun.
This indicator works great on all timeframes (from 5 minutes to monthly timeframes). Scalpers, intraday traders, swing traders and position traders can profitably use this indicator.
In addition to this, the price channel signal indicator is suitable for any market conditions. Range traders can use this indicator to identify support and resistance levels. In addition, trend traders can also use this indicator to identify dynamic support and resistance zones.
How to use the price channel signal indicator
The Price Channel Signal indicator can be used alone or in combination with other technical indicators. This indicator is best used in conjunction with price action and market structure analysis to get the best result.
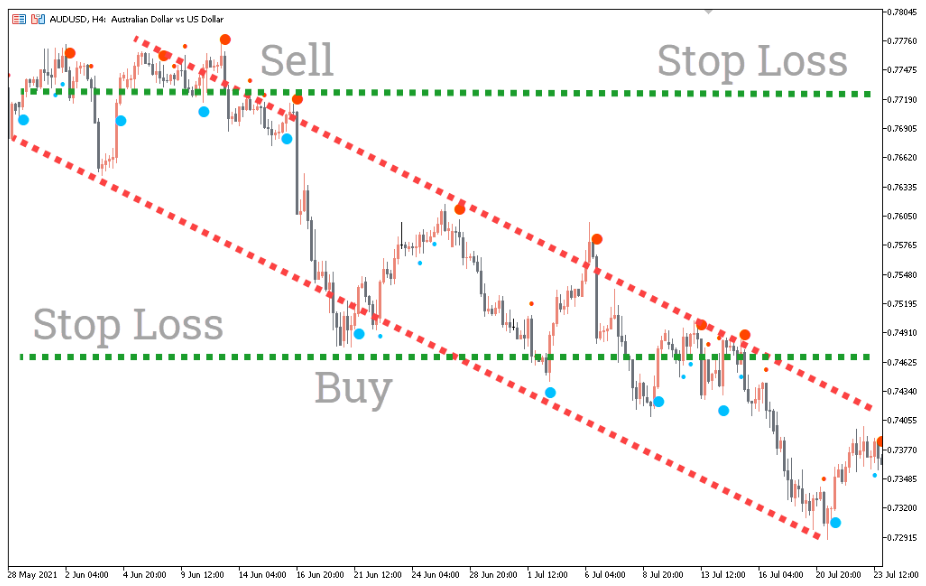
The AUDUSD H4 chart below shows how to use this indicator on MT5.
On the H4 chart above, the AUD/USD pair is in a downtrend, as indicated by the red trend lines. These trendlines form dynamic support and resistance levels when the price bounces off them.
On June 16, 2021, the candle fires the upper downtrend line, forming a doji. therefore, the indicator shows a red dot indicating a sell signal. A short position can be placed after the doji closes. Stop loss should be placed in the area of 0.77189 (indicated by the green horizontal line on the chart). The sell trade must be closed when the red dot changes to blue.
Also on June 18, 2021, a Japanese candle set fire to the lower downtrend trend line, after which a bullish engulfing candle formed. Finally, the indicator shows a sea-green dot indicating a buy signal. A long position can be placed with a stop loss around 0.74620. This long trade should be closed when the indicator shows a red dot.
Conclusion
The Price Channel Signal Indicator For MT5 helps traders to easily identify trading channels and places to enter and exit a trade. This indicator works on all timeframes and conditions.
The indicator can be used on its own, but is best used in conjunction with price action and market structure analysis.
You must be logged in to post a review.

Copyright 2025

Reviews
There are no reviews yet.