Price channel MACD RSI Forex Trading System
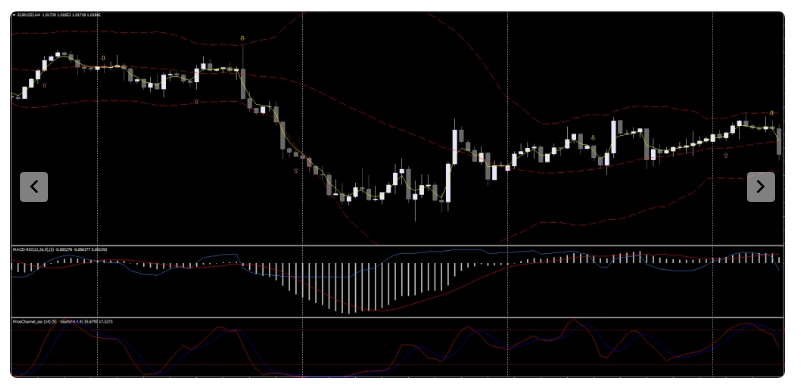
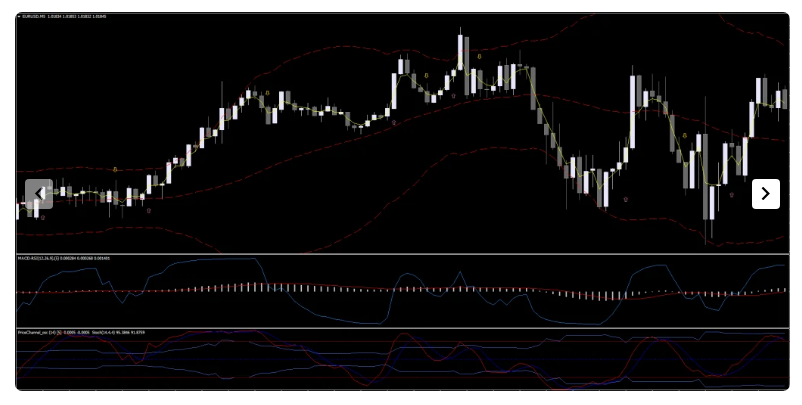
Bollinger Bands – A very popular indicator among the traders for identifying overbought/oversold conditions of the market. Its upper band is considered the overbought area and the lower band is the oversold area of the market.
3 EMA – It is a 3-day period Exponential Moving Average used to identify the short-term market trends. Price holds above its position when the trend is bullish and moves below its level to signal the bearish trend of the market.
MACD – An well-known momentum oscillator that works at its best to identify the market momentums. MACD value is positive when the momentum is bullish and turns negative in order to signal the bearish market momentum.
MACD RSI Arrow – This indicator signals the trade entries with a collaboration of MACD and RSI. It plots an upward arrow below the price bar to signal the long entry when MACD turns positive and the RSI value indicates the oversold condition of the market. Contrarily, a downward arrow above the price bar is formed to signal the short entry when MACD turns negative and RSI signals the overbought condition of the market at the same time.
Price Channel OSC – Price Channel Oscillator plots the crossover trend signal in order to filter the trade signals plotted by other indicators of the system. Its red slope moves above the blue one to represent the bullish crossover and the blue slope moves above the red one to indicate the bearish crossover of the market trend.
This Forex Trading System Trading rules
For scalping and intraday trading sessions time are London and New york. It works great on M5 timeframe. But you can use it on any. We also recommend keeping a look for support & resistance when entering trades.
Buy signal or Call
Price approaches or crossed the lower Bollinger Bands
A Bullish bar closes above the Yellow EMA
MACD RSI Buy Arrow is plotted above the price bar pointing downwards
The Price Channel has crossed upward the lower channel of the Price channel.
Sell signal or Put
Price approaches or crossed the upper Bollinger Bands
A Berish bar closes below the Yellow EMA
MACD RSI Sell Arrow is plotted above the price bar pointing downwards
The Price Channel has crossed downward the upper channel of the Price channel.
Exit position
Exit at the opposite arrow, at the upper or lower bands, the middle band of the Bollinger Bands, or with a predetermined profit target that depends on the time frame. You can use any of these methods or all to exit from trades.
If the Price channel MACD RSI Indicator is used for Binary Options
1-Minute chart for 4-6 minute expiration(4 to 6 candles).
5-Minute chart for 20-30 minute expiration(4 to 6 candles).
You must be logged in to post a review.

Copyright 2025

Reviews
There are no reviews yet.