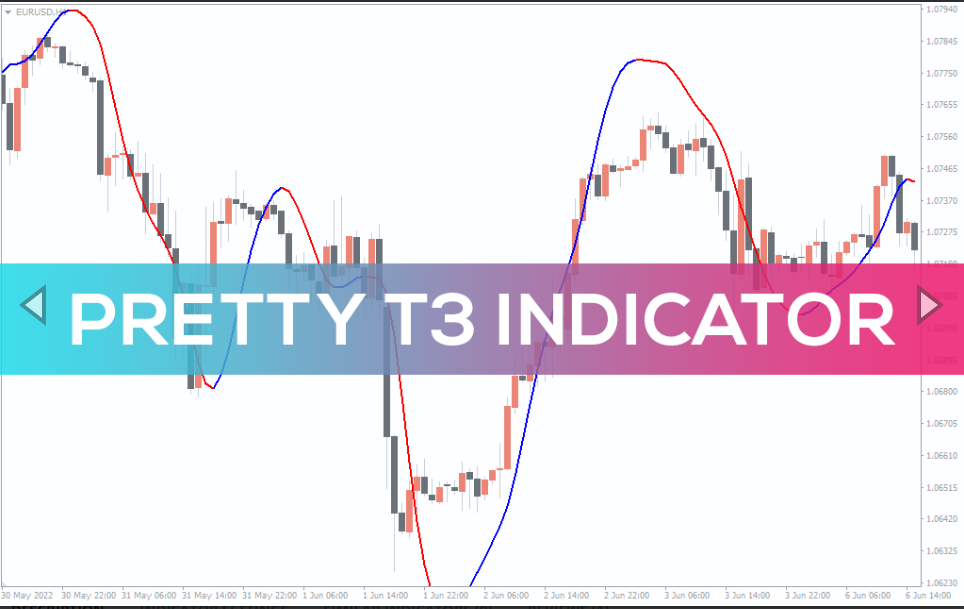
Pretty T3 Indicator
Spot best buy-sell opportunities using super trend signals of Pretty T3 Indicator for MT4. Detects support/resistance & price swing levels on forex/stock charts.
The Pretty T3 Indicator is a super trend-following MT4 trading tool, well-known for delivering real-time trend signals.
From a technical point of view, Pretty T3 Indicator is a beginner-friendly trend indicator. It offers a simple demonstration of buy-sell signals on MTF charts. Eventually, it enables novice traders to read and understand current trend conditions and make accurate trading decisions.
While backtesting the indicator, we’ve found it a suitable match for hourly to daily timeframe charts. So, traders looking for simultaneous day and intraday signals in forex and stocks may find this indicator extremely helpful.
This technical guide will teach you how to determine accurate trend-oriented buy-sell signals using the Pretty T3 Indicator in MT4.
How to trade forex and stocks by using the Pretty T3 Indicator for MT4
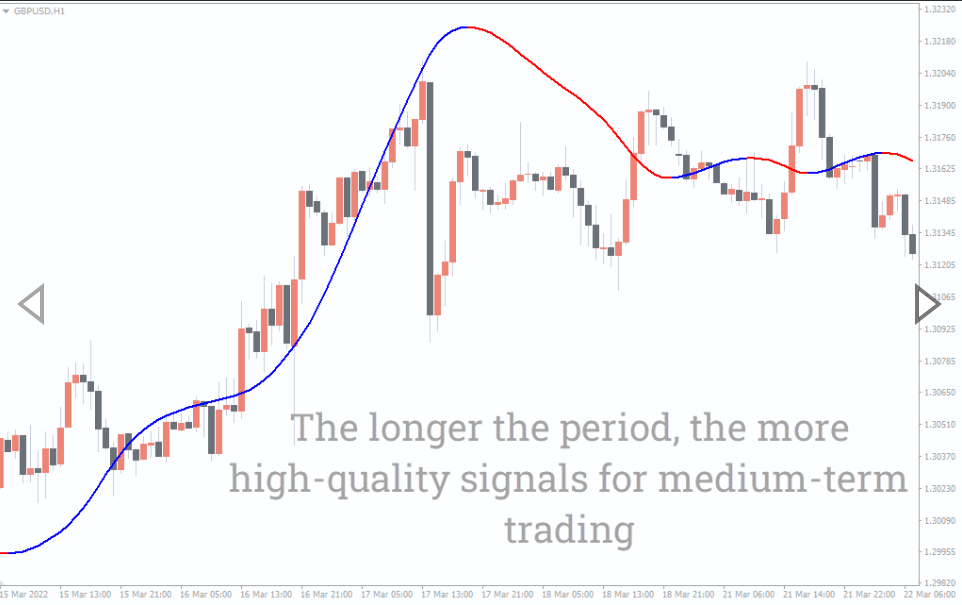
The Pretty T3 Indicator applies a 7-period Tilson moving average for determining the market trend. The movement of the signal line depends on the typical price, which is an average of high, low, and close prices.
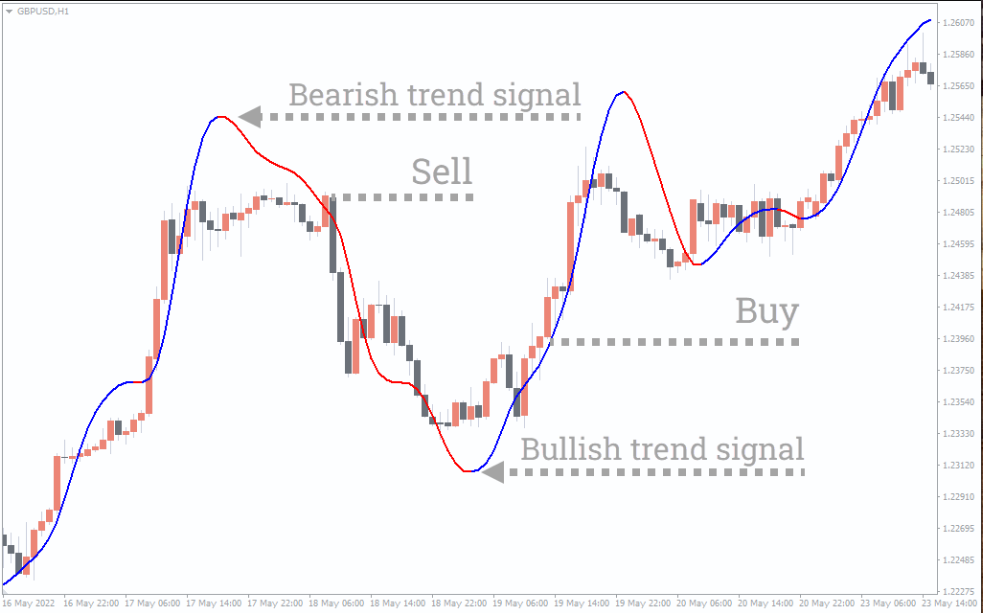
You’ll find T3 signal line changes its color whenever it detects a shift in market trends. The indicator level turns blue when the trend changes to a bullish mode. Contrarily, it remains red during a downtrend market condition.
This indicator helps assess valid buy-sell zones. The price respects the signal line as a dynamic support/resistance level during an ongoing trend. Therefore, you consider the indicator level as a possible price retracement zone. Target pullback entries when the price gets restricted inside the trendline.
For instance, the indicator level turns red, suggesting a persistent downtrend condition of the market. During such situations, wait for a price pullback to the moving average line and look for a bearish candlestick pattern to confirm a sell order.
In the same way, look for buy opportunities near the moving average level once the indicator turns blue, confirming a bullish trend. Like the above example, the T3 signal line turned blue after the price had rebounded from the market low. Later, a bullish pin bar rejecting the indicator level confirmed a continuation of the current uptrend, which we can consider as a buy order signal.
Trading based on the Pretty T3 signals may not work well during consolidation periods or highly volatile markets. Therefore, avoid making fresh entries until the indicator plots a trend-continuation signal.
Conclusion
The Pretty T3 Indicator is an automatic MT4 trend signal generator offering the best technical support for trend-following traders. Besides, the T3 moving average also works as trendline support/resistance, showing possible price pullback zones. Therefore, try to pick the signals and place buy-sell orders during an on-trend market.
You must be logged in to post a review.

Copyright 2025


Reviews
There are no reviews yet.