PR Support and Resistance Indicator
PR Support and Resistance indicator for MT5 – Trend reversal indicator. Auto support resistance indicator.
Support and resistance are basic and widely used trading strategies in the world of financial trading. The PR Support and Resistance indicator for MetaTrader is the best technical tool for identifying potential support or resistance zone areas.
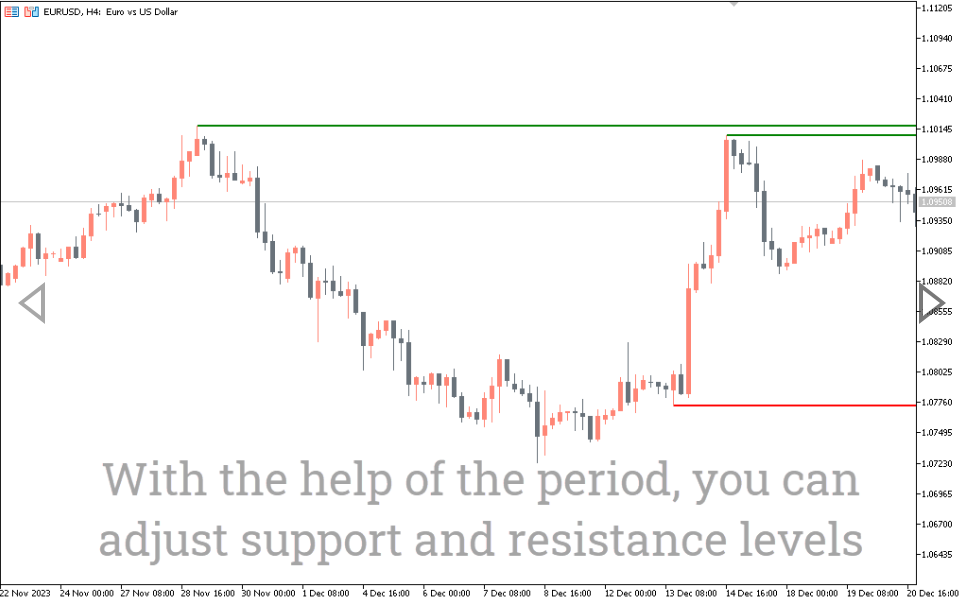
The indicator is a multi-timeframe indicator that automatically scans different timeframes looking for support and resistance zones. Displays lines of support and resistance zones of a given period on all timeframes. This means that the indicator will show support and resistance lines H4, D1, W1 and MN, for example, on the H4 time frame.
This technical indicator automatically identifies and draws zones on your MT5 chart, making it easy to trade support and resistance zones.
This indicator can be used for various trading strategies such as scalping, day/intraday trading and swing trading. In addition, the indicator will be an excellent help for novice traders who are still trying to understand how to identify such zones. The indicator will also help advanced traders save more time.
How Do You Identify Forex Support and Resistance?
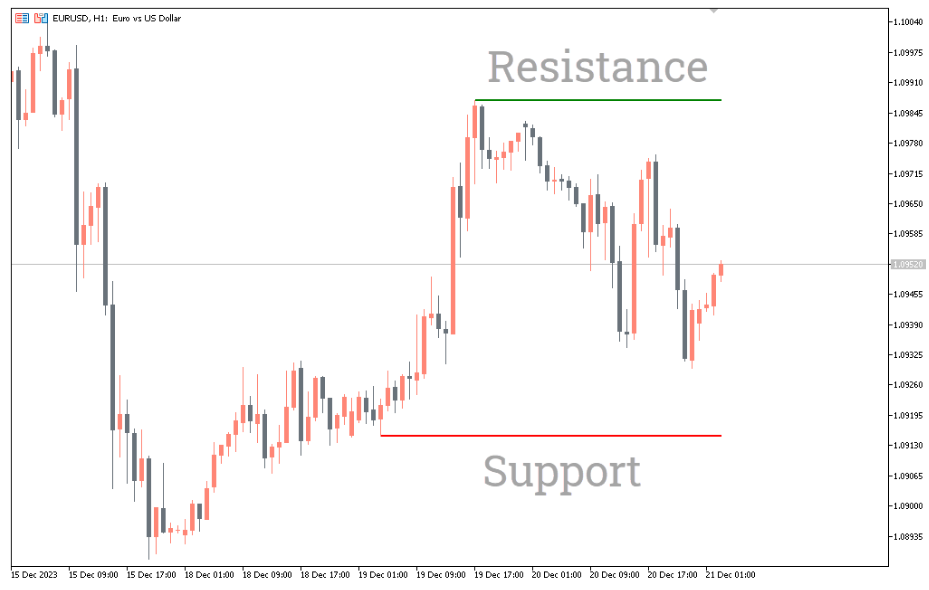
Major support and resistance levels are determined around the highs and lows created by the market. This means that lower lows are potential support zones and higher highs are potential resistance zones. Additionally, physiological levels (rounded numbers such as 1.4200, etc.) of price are also potential support and resistance zones.
How to draw support and resistance lines?
Support and resistance lines are drawn either as a trend line or as a horizontal line. The idea is to draw a line connecting at least two peaks or troughs.
How to trade with the PR support and resistance indicator
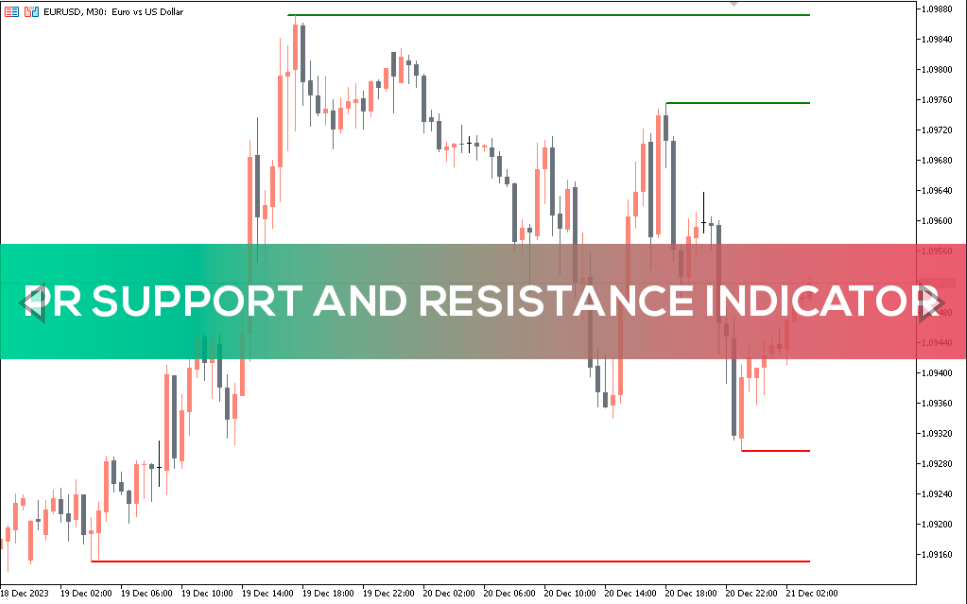
The screenshot above shows how the indicator will look on an MT5 chart. Several lines represent support and resistance zones on several time frames. GREEN lines are resistance zones and RED lines are support zones.
The indicator can be used for trading reversals and trend continuations. Please note that a broken support zone becomes a potential resistance zone and vice versa. This means you can look for a trend reversal pattern for a BUY/SELL entry when the price bounces off the indicator. Similarly, you can look for a price continuation pattern (such as a lightning bolt pattern) and open a BUY or SELL trade in the direction of the broken support and resistance level.
Conclusion
The PR support and resistance indicator for MT5 makes technical analysis more convenient. This will help you quickly identify potential support and resistance zones with just one glance at the chart. Finally, the indicator is free to download.
You must be logged in to post a review.

Copyright 2025

Reviews
There are no reviews yet.