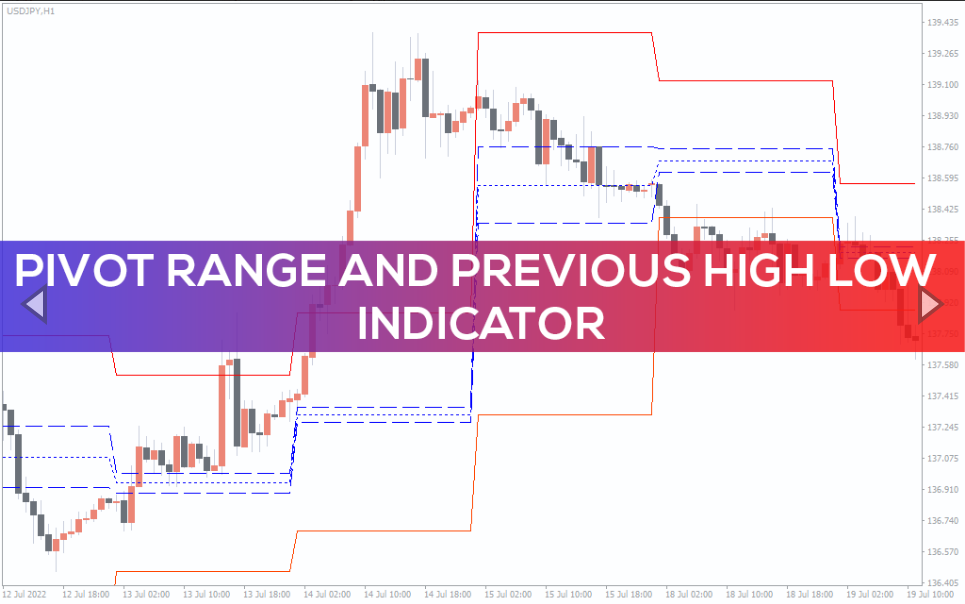
Pivot Range and Previous High Low Indicator
Learn the best way to anticipate forex & stock buy-sell signals using the pivot range and previous high-low price channel. Suits intraday trading on MTF charts.
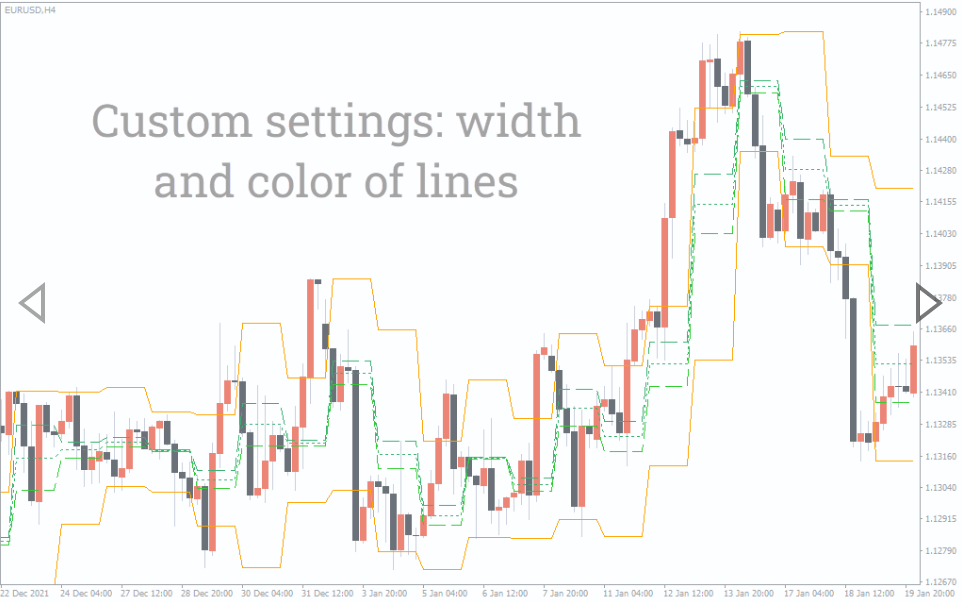
The Pivot Range and Previous High-Low indicator plot a dynamic price channel, guiding traders through key support/resistance zones in all trading sessions.
By applying this indicator on MT4, one can trade in accordance with important price levels and critical pivot points. Trading positions can be taken based on the various levels on the chart. Due to its adaptability and simplicity of use, it is well-liked among daily traders in forex and stocks.
Besides, the High-Low channel, a market breadth indicator, determines whether an index is strong or weak. It is calculated by dividing current highs by the total of new highs and new lows, multiplying that result by 100, and then plotting the resulting value against a 10-day SMA of that series to smooth out the results.
This guide teaches you how to make profitable trading decisions using the Pivot Range and Previous High-Low indicator in MetaTrader 4 platforms.
How to identify potential buy-sell signals using the Pivot Range and Previous High-Low MT4 indicator
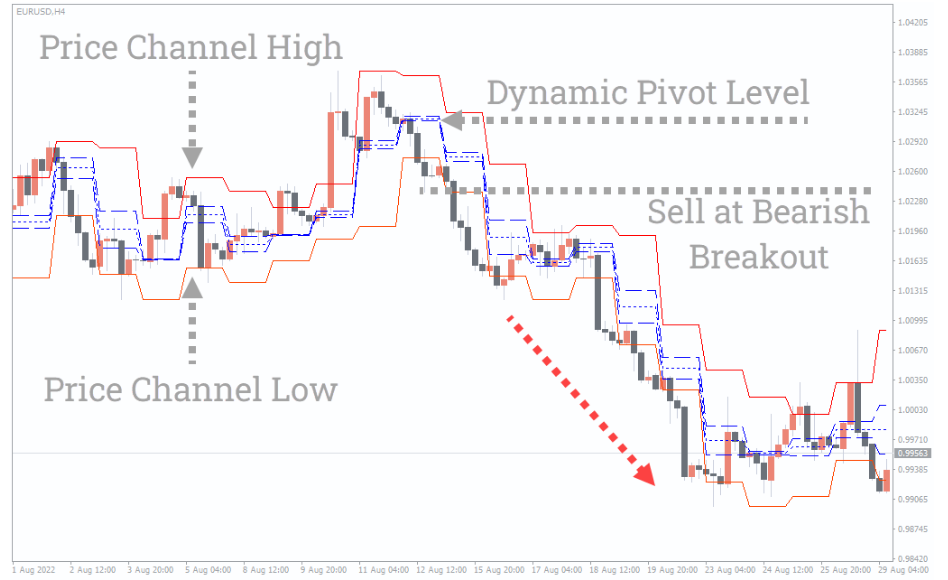
The Pivot Range and Previous High-Low show the current pivot level that works as an intraday price breakout zone. Once the price exceeds the pivot level, we consider it a bullish market trend and look for buy opportunities. Contrarily, concentrate on potential sell signals while the price dives below the pivot line.
The higher and lower bands of the price channel guide you through the maximum pullback areas of the market. The price fails to exceed the channel’s support, or resistance provides useful hints on overbought/oversold markets and potential trend reversals.
In the above 4-hourly EURUSD, the price was initially in an uptrend but lost momentum once the price returned below the pivot range. Later, the price dropped below the channel’s low, confirming a downtrend following the bearish breakout.
Trading based on breakouts at the support/resistance of the channel offers better confirmation of the current market momentum. Although, it can squeeze your profit margin due to late entry. In such a case, you can also look for buy-sell signals close to the pivot line.
For instance, the price moves above the pivot range, signaling a bullish market trend. Upon receiving the trend confirmation, you may wait for a pullback near the support to go long. While going long, don’t forget to place an SL below the channel-low. Contrarily, set the SL above the channel-high for short entries.
Conclusion
The Pivot Range and Previous High-Low is a multifunctional MT4 indicator that enables you to go for a versatile trading approach on MTF charts. Its dynamic price channel and pivot lines offer further confirmation while anticipating buy-sell opportunities. At the same time, you can try it alongside your existing trading strategies to improve trading accuracy.
You must be logged in to post a review.

Copyright 2025


Reviews
There are no reviews yet.