Pivot Custom Indicator
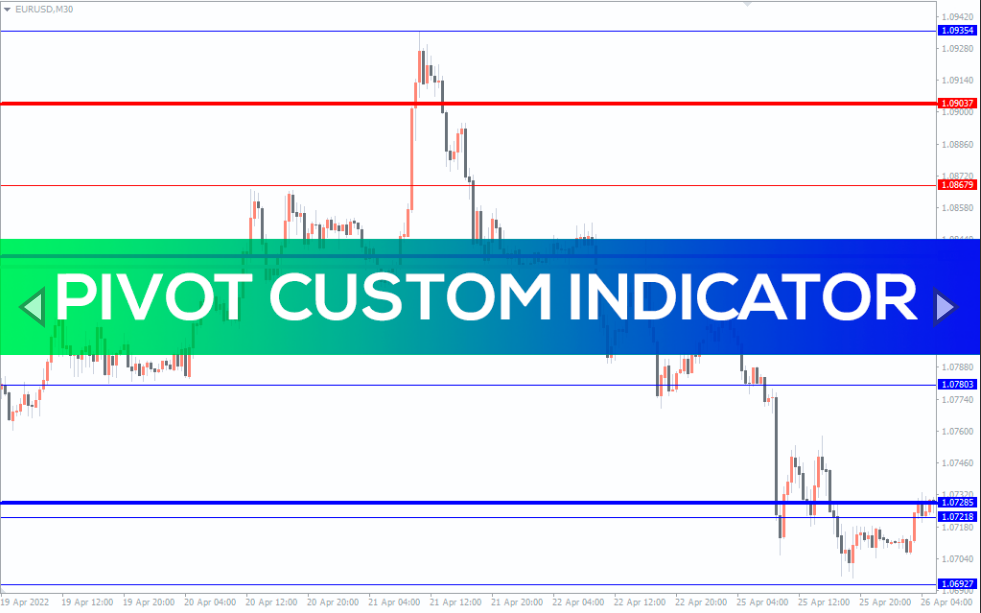
Pivot Custom Indicator For MT4 automatically plots the pivot levels of multiple time frames on the current price charts.
The Pivot custom indicator for MT4 automatically calculates and plots the pivot levels of various time frames on the current chart. Furthermore, the indicator plots three resistance levels above the pivot level. And plots three support levels below the pivot level. So, forex traders can use the pivot levels and place buy and sell orders accordingly.
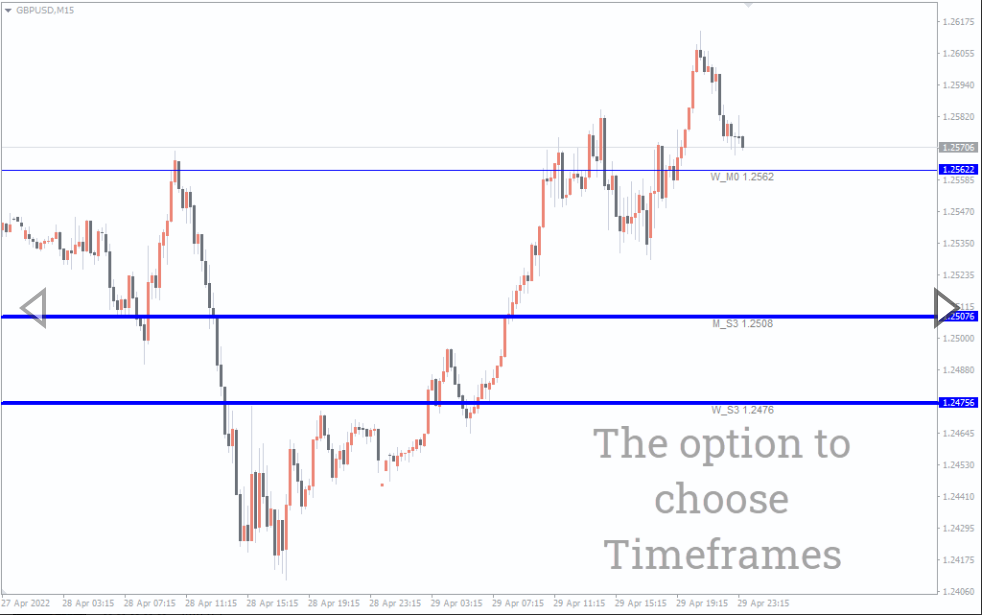
The indicator works in all intraday time frames and the daily, weekly, and monthly price charts. Trading using pivot levels is similar to support and resistance trading. So, new and advanced forex traders can buy and sell successfully using this MetaTrader indicator. For the successful application of the indicator, forex traders should identify and confirm the price reversal and breakouts using the support and resistance trading strategies.
Pivot Custom Indicator For MT4 Trading Signals
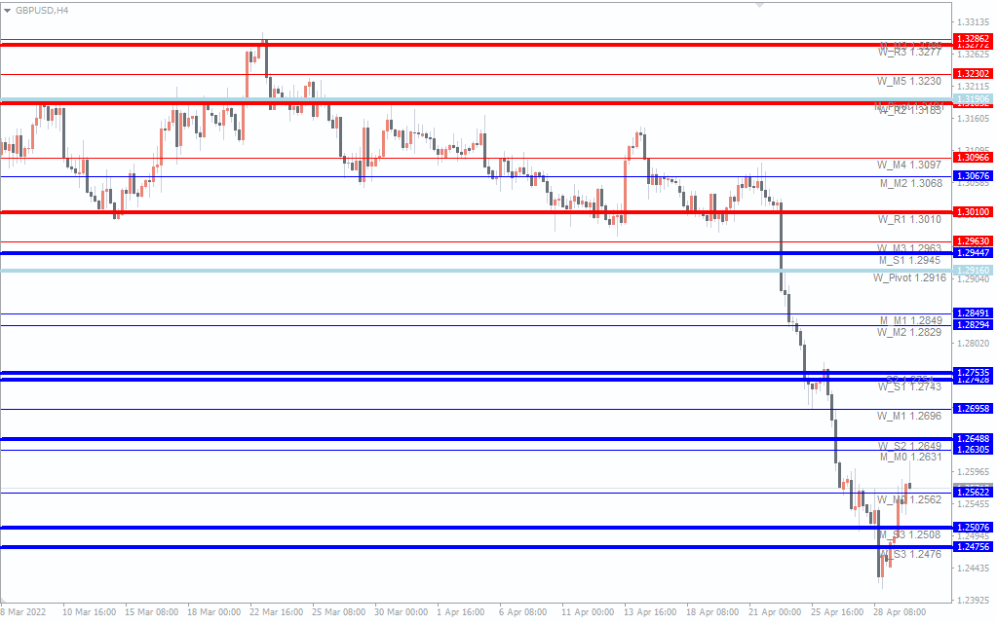
The above GBPUSD H4 candlestick price charts show the Pivot custom indicator for MT4 in action. The indicator plots the mid pivot line in light blue. Furthermore, it plots three resistance lines as R1, R2, and R3 in red. Similarly, the indicator calculates and plots the three support levels S1, S2, and S3 in blue.
If the price moves higher than the pivot point it indicates the potential bullish trend. So, traders should look for placing buy orders near the support levels and target to book profits at higher pivot levels. Similarly, the pivot level below the entry point acts as a stop loss as price movement below the pivot will invalidate the bullish trend.
Similarly, if the price moves below the mid-level or the mid pivot point it indicates a potential bearish price trend. So, traders should enter the market with a sell position near a resistance level and target the support levels for profit booking. For this trading strategy the pivot level higher than the entry point acts as a stop loss.
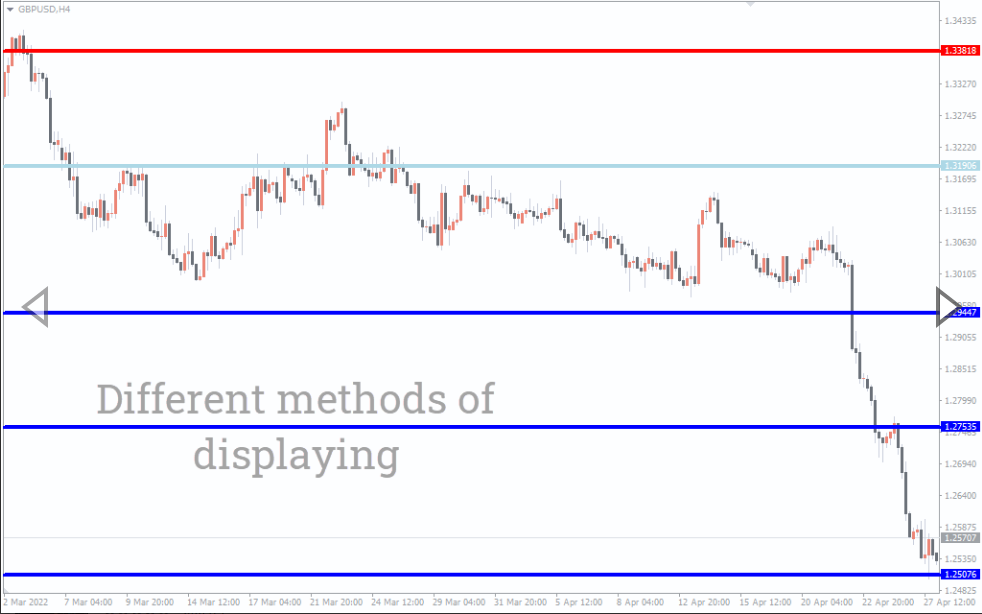
Another interesting trading is the application of R3 and S3 as entry points. The logic behind this trading strategy is to take advantage of potential overbought and oversold conditions. Once the price moves and reaches resistance R3 or Support S3, the price would have moved considerably and may begin a retracement or reversal phase.
So, forex traders can enter the market with a sell position at the R3 level and place a buy trade if the price reaches the S3 level. As the price is in an overbought or oversold condition during the entry, traders can benefit from the entire retracement move which may result in substantial profits.
Conclusion
The Pivot custom indicator for MT4 is an essential trading indicator for the traders using the breakout and reversal trading strategies. So, technical forex traders should be aware of false breakouts and avoid the same. Additionally, forex traders can download the indicator for free and install it easily.
You must be logged in to post a review.

Copyright 2025

Reviews
There are no reviews yet.