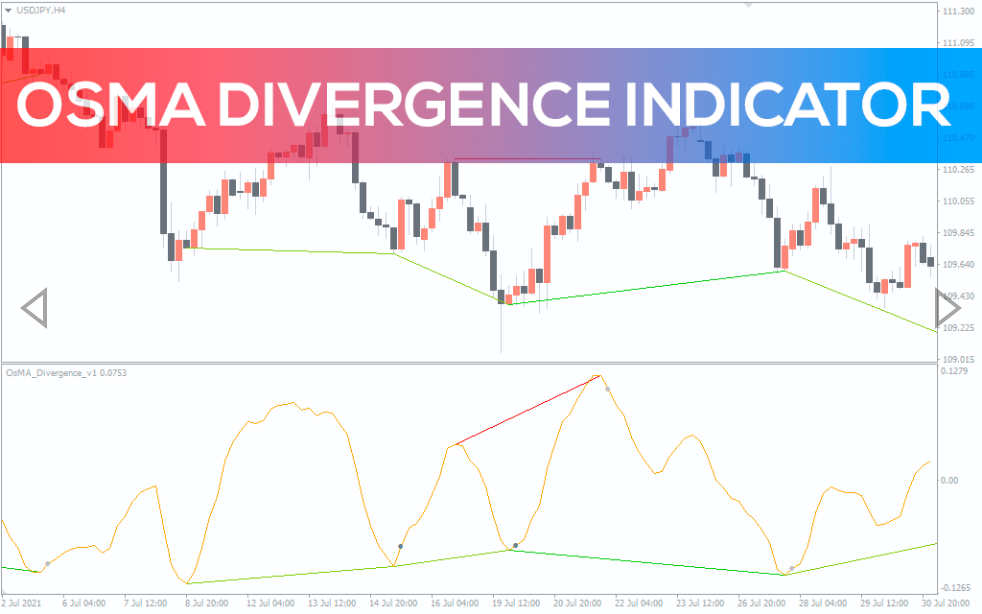
OsMA Divergence Indicator
The super tool to find divergences with classic OsMA indicator. It supports different types of divergences.
What is OsMA?
OsMA stands for Moving Average of Oscillator. OsMA is a variant of another, more popular MACD indicator.
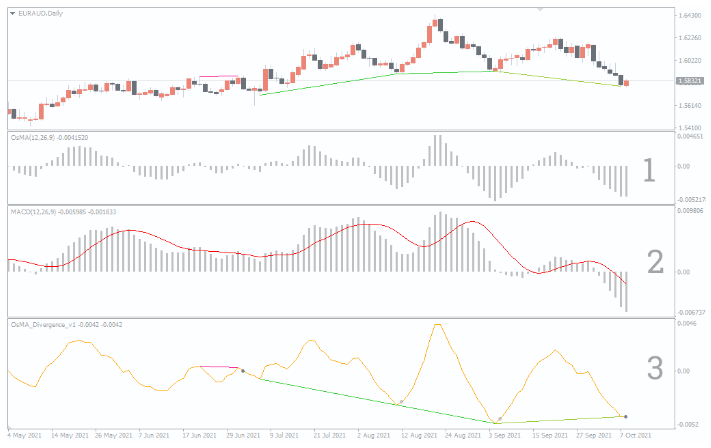
Both classic technical indicators OsMA (shown on the screenshot below as number 1) and MACD (shown as number 2) are included by default in Metatrader 4 terminal.
As you can see, the OsMA simply shows the difference between the MACD histogram and its signal line.
We suggest you download (FREE) and use the super indicator (shown as number 3), which analyzes the OsMA and the price chart to show you the divergences.
What are divergences?
Divergences occur when highs/lows on the price chart and highs/lows on the indicator chart show different dynamics.
Technical analysts distinguish:
Classic (or regular) divergences, which give signals of trend
Hidden divergences, which give signals of trend
Since divergences between the price and the indicator provide many false signals, consider the major trend. Give preference to sell signals in a bearish market and buy signals in a bullish market to increase the likelihood of profits.
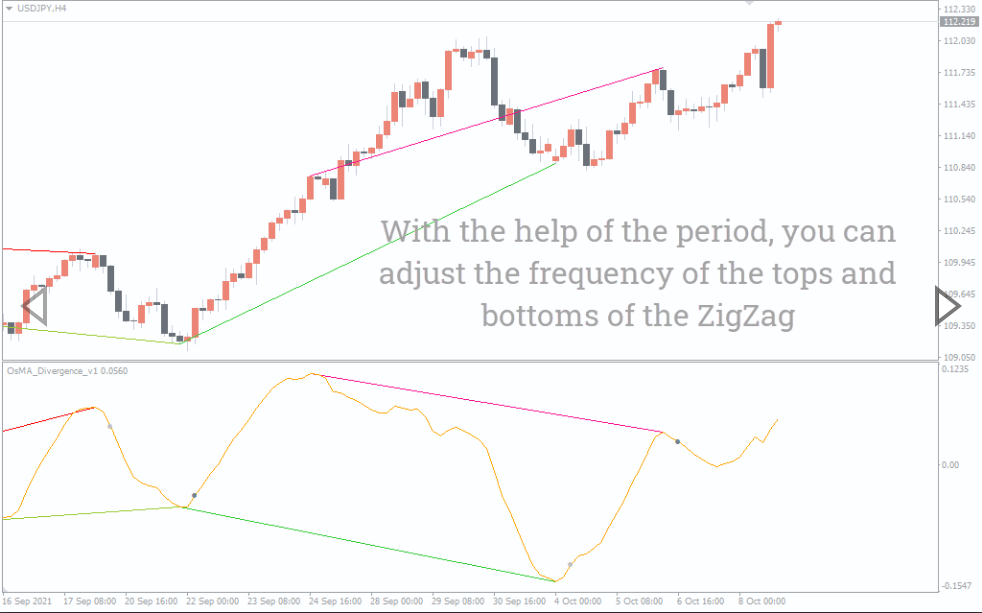
Try OsMA Divergence Indicator for MT4 – is the best tool to automatically search for divergences between the price and the OsMA line.
Using this indicator, you can analyze how effective the divergences in the selected market are. This helps you find the best intraday strategy to buy and sell.
Sell Signals
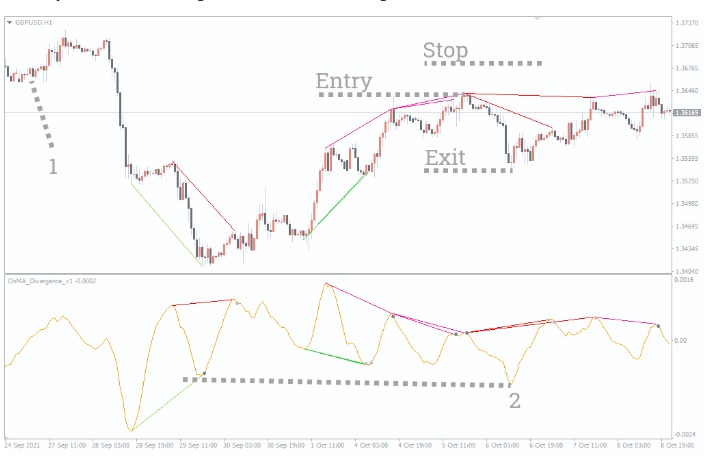
We recommend that you pay attention to support and resistance levels in order to increase the accuracy of the OsMA Divergence Indicator for MT4 signals.
When price broke through support (1), we can expect this level to act as resistance. Therefore, a triple bearish divergence is reason enough to open a short position below 1.36563 line. Put the stop-loss order above the resistance level. You may close position when the OsMA reaches a new low (2).
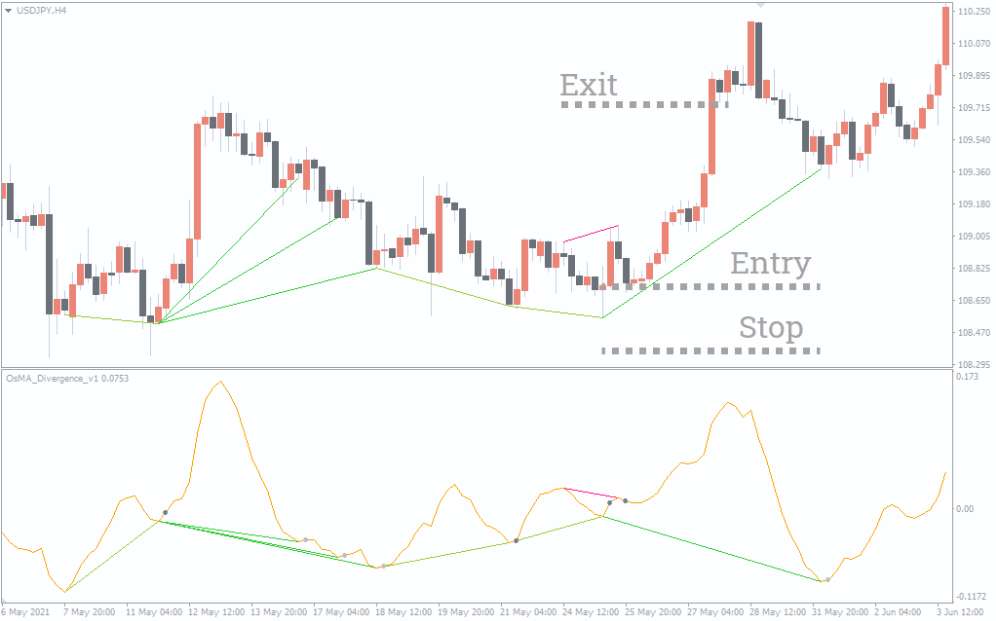
Buy Signals
The 108.5 level works as support. Therefore, when you see a bullish divergence at the support level, it gives you reason to believe that the support will hold. Accordingly, a long position may be opened. Place a stop below support (or below previous lows), and take your profit when prices reach new highs.
Conclusion
The OsMA Divergence Indicator for Metatrader allows you to find divergences between price and classic OsMA oscillator. It doesn’t repaint.
The indicator allows you to:
find divergences fully automatically;
trade on daily, weekly and intraday charts;
analyze signals on history;
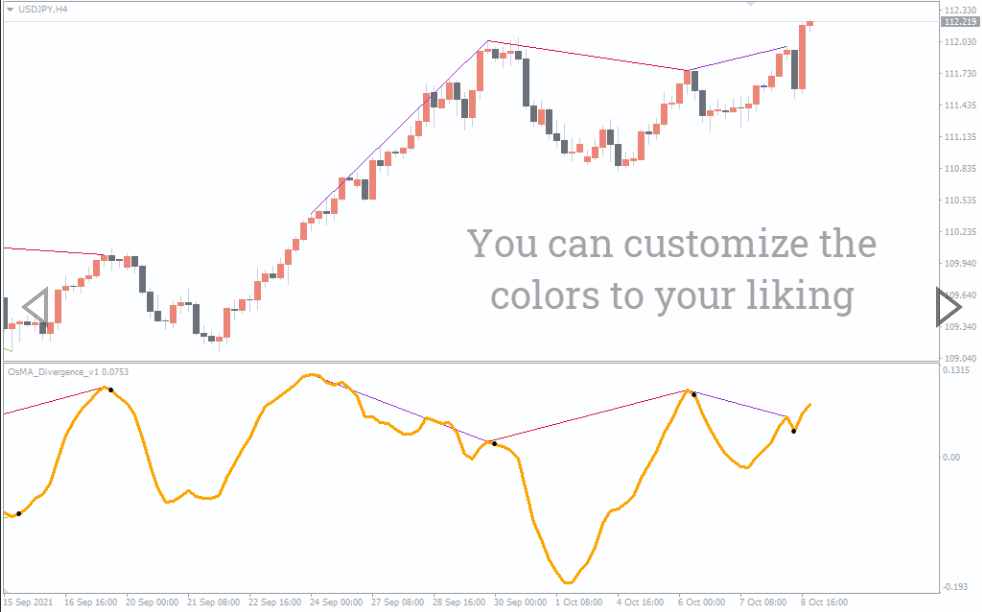
set up divergences display.
Be aware, the OsMA Divergence Indicator for Metatrader does not guarantee accurate buy and sell signals. However, you can effectively increase the accuracy of the signals, for example, if you focus on:
sell signals in a bearish market;
buy signals in a bullish market;
sell signals near resistance zones;
buy signals near support zones.
Open a demo account with a reliable broker and practice trading divergences to see how well the indicator signals meet your trading style. Don’t forget to place stop-losses!
Download this MT4 indicator for Free Now!
You must be logged in to post a review.

Copyright 2025

Reviews
There are no reviews yet.