No Repaint Indicator
No Repaint is a swing trading indicator for MT4 platforms. Anticipates potential price swing zones, breakout positions, and buy/sell levels. Fits MTF charts
The No Repaint is a non-repaint fractal indicator developed for anticipating precise price swing levels in MT4 charts. Besides, it helps you understand how the price reacts in critical support/resistance zones before making trading decisions.
Technical analysts, especially beginners, predominantly suffer from confusion over the price behavior in key market levels. For instance, you activated a buy order following a potential bullish price breakout. Later, you found it was a false break, and the price is about to hit your stop-loss limit. It is a regular incident for the traders who struggle to assess actual price actions due to a lack of trading experience and market uncertainties.
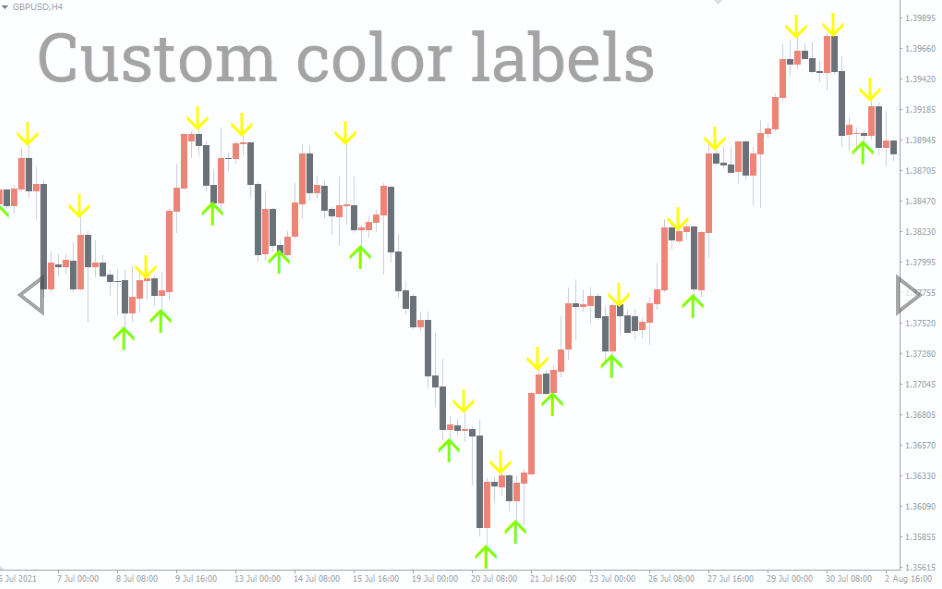
Portraying the real-time price momentums is a core mission of the No Repaint indicator. It shows you the price’s potential bullish/bearish reversal intentions based on recently closed candles. The simple arrows on the chart work like a live traffic signal indicating the possible upcoming direction of market momentums.
In this guide, you’ll learn how to trade forex and stocks profitably by using the No Repaint indicator on MT4 platforms.
How to anticipate potential buy/sell signals with the No Repaint indicator in MT4
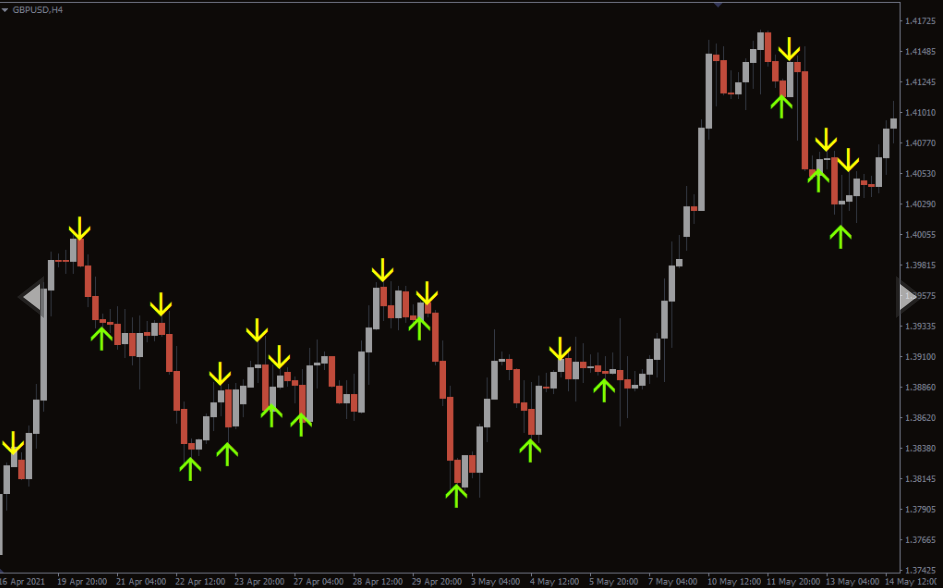
The No Repaint indicator closely monitors each price candle’s opening and closing positions. It detects inside bars closed within the range of previous candles high and low, highlights them as potential price reversal signs.
For example, a bearish pin bar forms inside the range of the last candle. It indicates the price has failed a bullish move attempt and looking forward to a potential bearish reversal. Such a price rejection under a strong resistance offers an ideal sell opportunity.
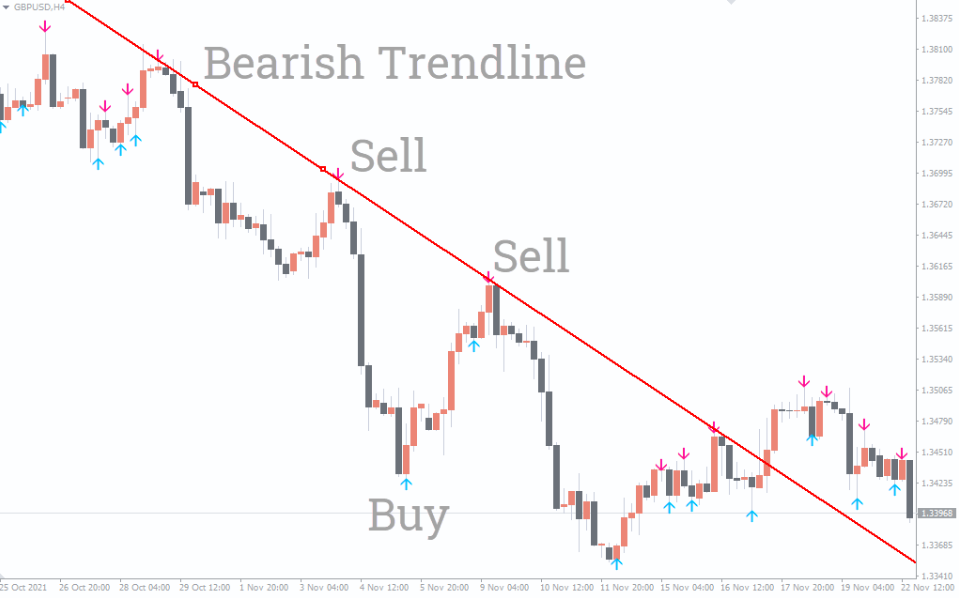
In the above GBPUSD 4-hour chart, we’ve spotted a solid downtrend where the price was respecting a bearish trendline as resistance. Each time the candle forms a rejection pattern near the trendline, the indicator plots an arrow above the price, indicating a downtrend move. In this case, you may trigger a sell order whenever the price breaks the signal candle’s low. Also, place a stop-loss limit above the arrow. Conversely, the No Repaint indicator requires plotting an arrow below the candle’s low while the price rejects a support line for confirming a buy order.
Like the buy/sell method, you cannot solely depend on the arrow signals for a trade exit. So, waiting to see how the price responds to a particular support/resistance zone is an ideal profit-taking strategy for an existing order.
Conclusion
Understanding the price actions in crucial support/resistance zone is an undeniable part of technical analysis. The No Repaint indicator makes it easier for you by signaling the potential price directions using simple arrows. However, it plots frequent alerts and may generate weak signals during sidelined and choppy market conditions. In such cases, using other price action tools like support/resistance, simple moving averages, and trendlines alongside the No Repaint indicator is ideal for enhancing buy/sell decisions.
You must be logged in to post a review.

Copyright 2025

Reviews
There are no reviews yet.