New Kaufman Indicator
Learn to trade using the AMA crossovers of New Kaufman trend signal moving averages on MTF charts of the MT4 platforms. Best for forex & stock day/intraday trading.
Categories: Trend, Signal, Informational
The New Kaufman represents a trend-following MT4 buy-sell signal indicator. It applies dual adaptive moving averages (ADA) parameters to plot crossover trend signals. Compared to advanced trend signal indicators and strategies, it is quite easy to assess current market trends using the New Kaufman indicator. Initially, technical traders applied the single moving average version of the indicator for analyzing market trends.
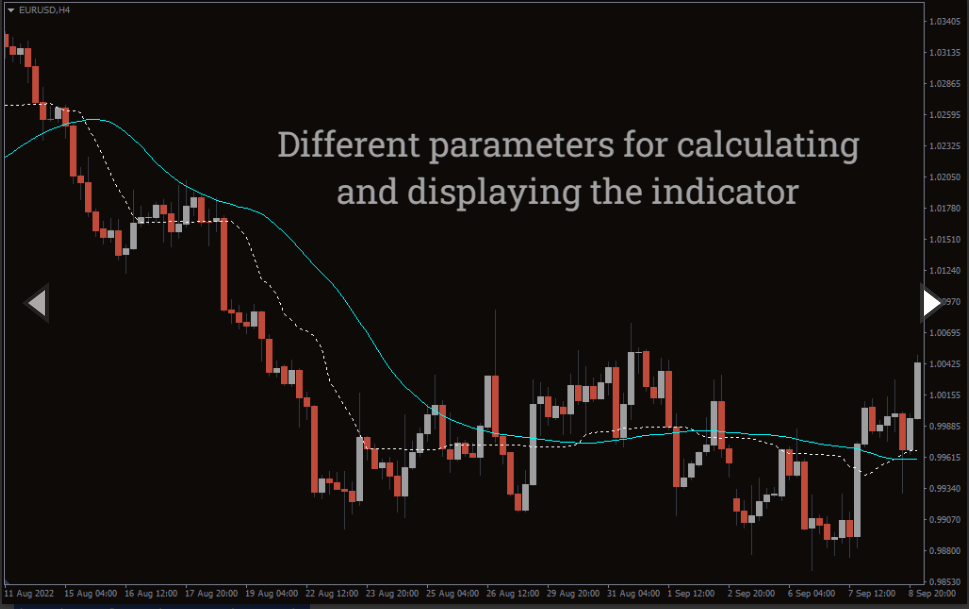
The latest New Kaufman involves two moving averages, enabling the indicator to better confirm the price trends and outlining short/long-term dynamic support/resistance levels. Furthermore, this indicator ideally suits all trend-based forex and stock trading strategies and can be used for MTF trend analysis purposes. This guide explains how to apply the New Kaufman indicator on MT4 to explore major changes in market trends.
How to Trade Forex and Stocks Using the New Kaufman Indicator for MT4
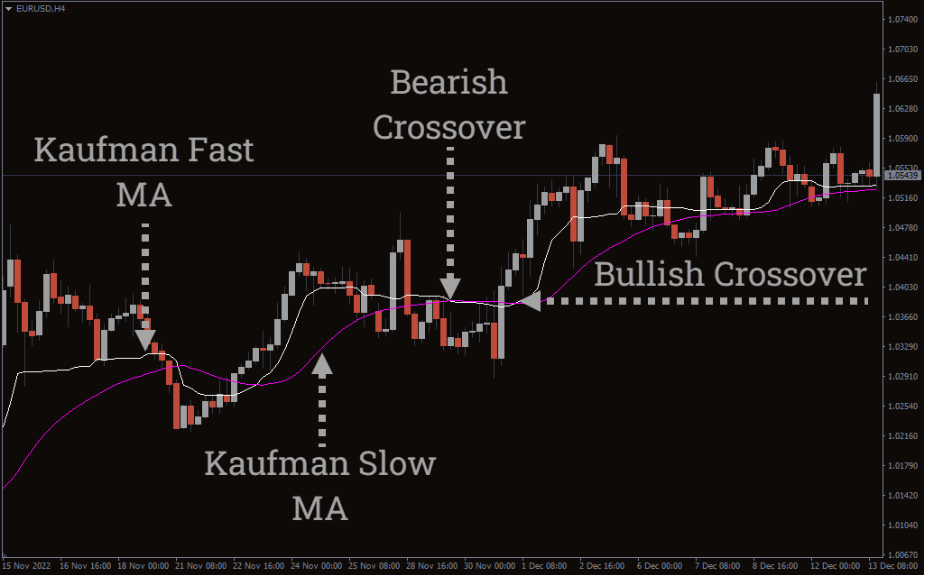
The New Kaufman indicator applies a 6-day central adaptive moving average. To plot crossovers, it uses 2-period fast and 60-period slow AMAs. When the fast AMA exceeds the slow AMA, we consider it a bullish crossover signaling an uptrend. Oppositely, the fast AMA moves below the slow AMA to plot a bearish crossover, indicating a downtrend market.
Besides, both of its moving averages offer dynamic support/resistance analysis support. The price often considers the AMA levels as key price action event zones. For example, the price fails to break above the fast AMA during a bearish crossover, indicating a sell opportunity.
The above EURUSD H4 chart shows how the New Kaufman crossover helps you identify the trend-following market movements. Once the fast AMA moves above the slow AMA, the price starts trending up and considers the moving average levels as support. According to the New Kaufman trading strategy, it’s a perfect condition to look for a buy entry opportunity.
When you’re looking to sell, look for a bearish crossover of the fast and slow AMA levels first. Next, wait for a relevant candlestick pattern near the moving average lines. For example, a bearish hammer rejecting the AMA resistances following a bearish crossover can be considered a sell confirmation.
Conclusion
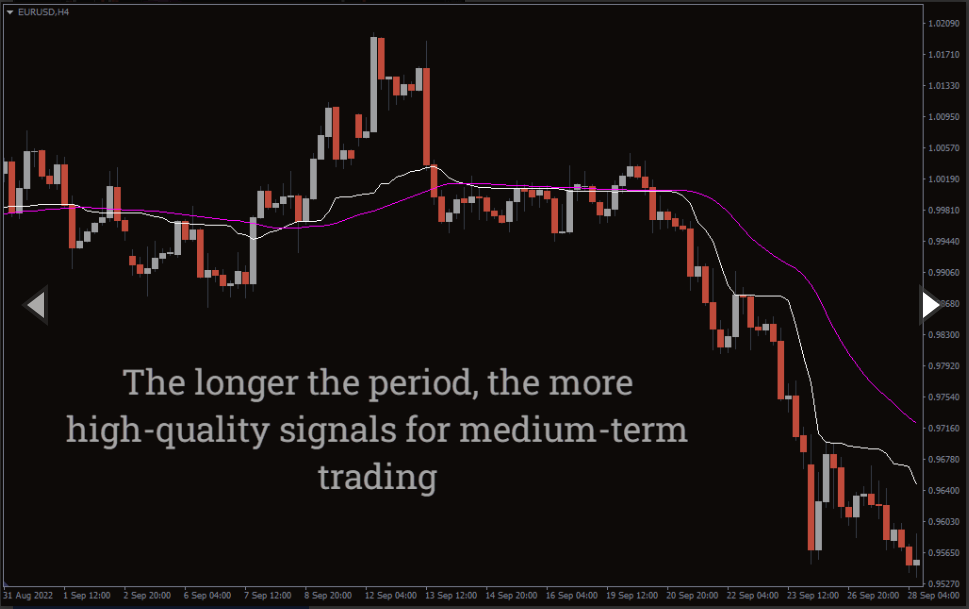
The New Kaufman AMAs are quite effective for verifying the direction of the current market trend. Its crossover signal helps you to predict an upcoming market bias in advance. Even if you’re not using traditional support-resistance levels, you can use the adaptive moving average levels to anticipate accurate dynamic S/R zones. Please note that the New Kaufman indicator may not work in all market conditions. It may plot weak signals in sluggish and choppy market conditions. Therefore, try considering an additional price-action indicator to add better confirmation to your trading decision.
You must be logged in to post a review.

Copyright 2025

Reviews
There are no reviews yet.