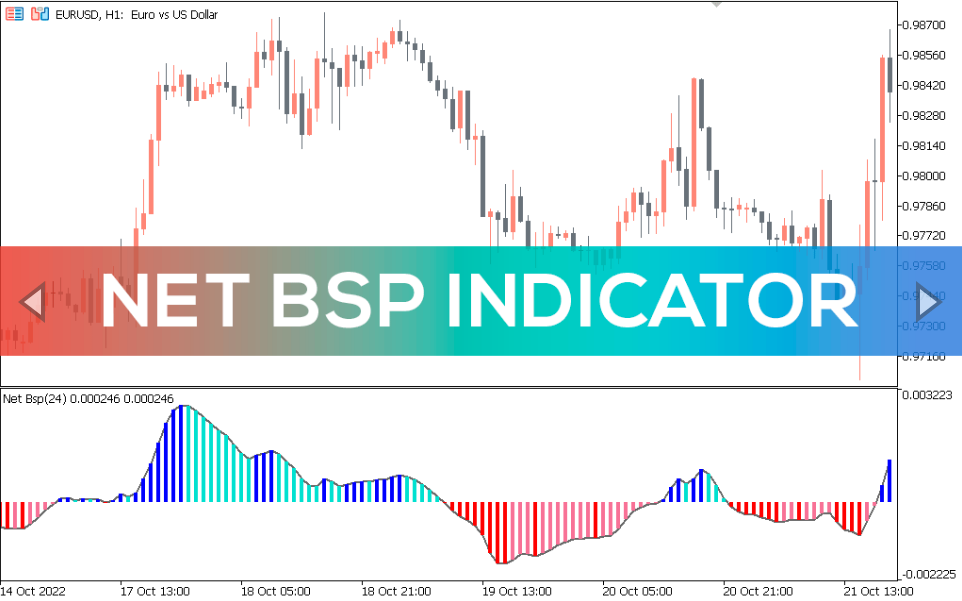
NET BSP Indicator
A suitable NET BSP indicator to determine the direction of the price. Ideal for determining when the market is bearish or bullish.
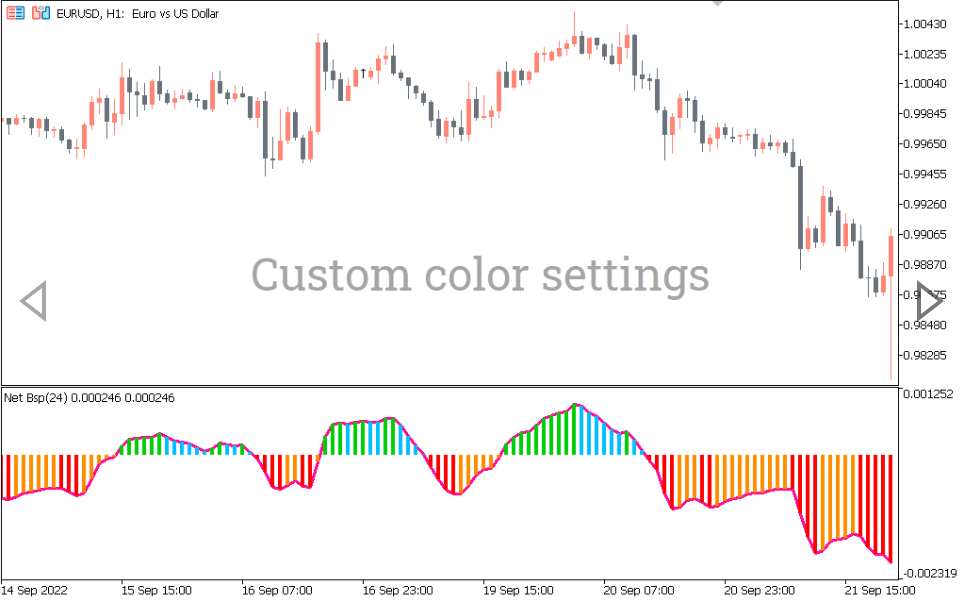
The NET BSP (Buying Selling Pressure) indicator for MT5 is a technical tool that helps measure buying pressure and selling pressure. Selling pressure is determined by comparing buying volume with total volume, while selling pressure compares selling volume with total volume.
In essence, the indicator shows market pressure. As a trader, this helps you determine whether you should go short or long. You must avoid going against market pressure.
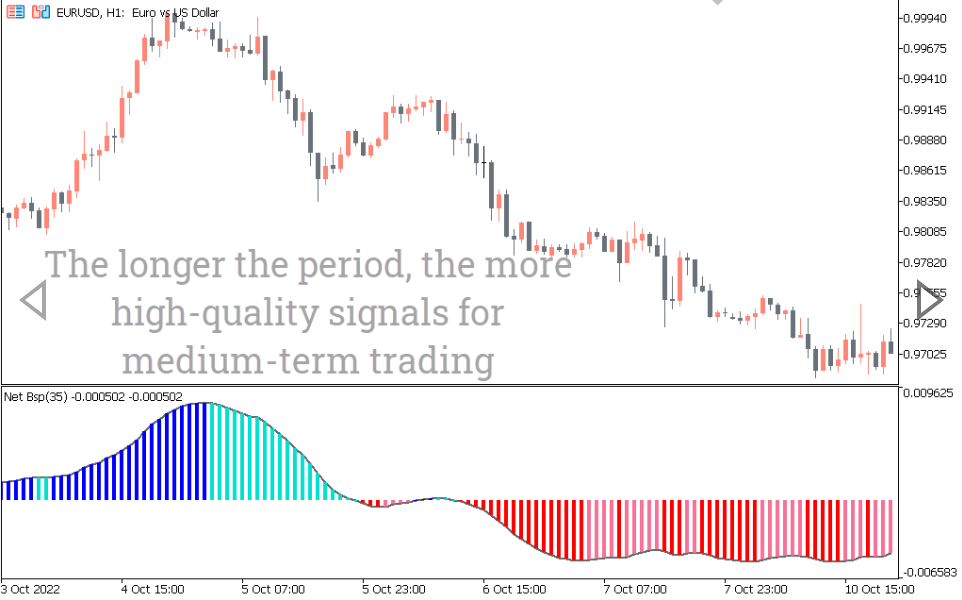
The indicator is suitable for multi-timeframe analysis and is suitable for all timeframes in MetaTrader. The indicator generally works well for all types of traders, from scalpers to long-term traders. However, you can use it with other indicators.
How To Use the NET BSP Indicator
The indicator shows the direction of the price and measures the momentum of the market. When buying pressure increases, the indicator rises, but the indicator moves down when selling pressure increases. It shows when the market is in a downtrend or uptrend.
Therefore, you will need to go long when the indicator rises and go short when it falls.
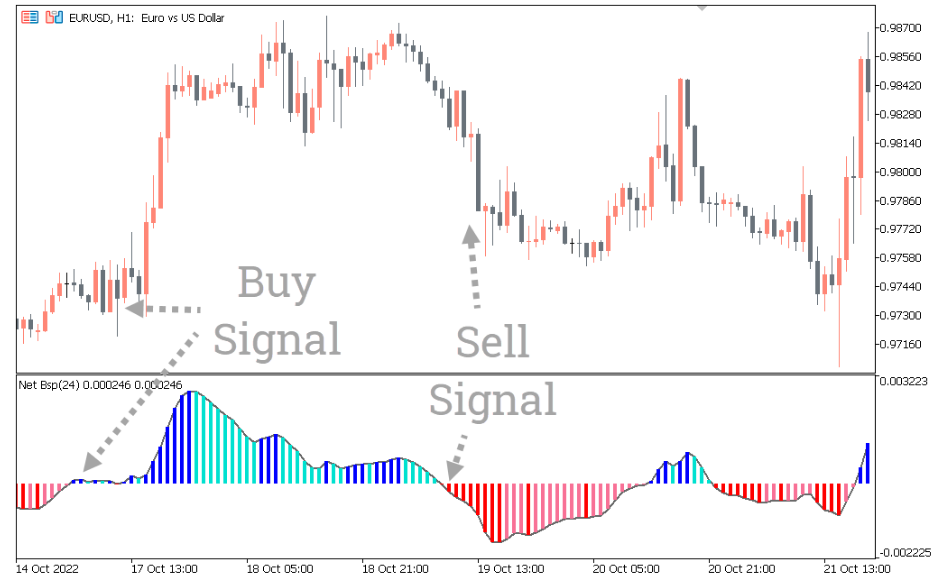
Buy signal
Buy when the NET BSP rises, indicating growing buying pressure in the market. . We exit when the indicators start to fall.
Sell signal
Sell when the NET BSP indicator falls, indicating increased selling pressure in the market. Exit when the NET BSP indicators start to rise.
Trading example
The price chart shows the NET BSP indicator in an hour time frame. During the momentum of a downtrend, the indicator moves down. When the indicator reaches its highest levels, it shows that momentum has peaked in that time frame. For example, during a strong bull market, the indicator peaks on the chart.
Bullish signal
When the momentum of the market spontaneously rises, the indicator also rises with the same momentum. During a rally, it shows that buying pressure is increasing and is in line with the rising indicator.
Bearish signal
The indicator also drops instantly when price momentum drops during this time period. During a downward pullback, selling pressure increases and the indicator moves down.
When the market fluctuates, the indicator line stagnates and moves sideways. This is a great tool for displaying market trend and momentum over a period of time.
Conclusion
The buy-sell pressure indicator is ideal for displaying the market pressure of sellers or buyers. Basically, you will need a short position when the selling pressure is high. Conversely, you want to go long when the market pressure is bullish.
You must be logged in to post a review.

Copyright 2025

Reviews
There are no reviews yet.